- Published on
- •👁️
JPA N+1 문제 해결에 따른 성능 변화 분석 - 4. 테스트 결과 1
- Authors

- Name
- River
목차 페이지로 이동
데이터 규모에 따른 JPA N+1 문제 진단과 해결 전략 비교
(Fetch Join, Entity Graph, Batch Fetching)
목차
4.1. 테스트 케이스 1 결과
테스트 케이스 설명
소규모 데이터
- Member : 100명
- Animal : 100마리
- AnimalCase : 200개 (Member 당 2개)
- Protection : 100,000개 (AnimalCase 당 500개)
Batch Fetching
- default_batch_fetch_size: 0
API 버전
- Pure : 해결 전략 없는 상태 (N+1 문제 존재)
- Optimized : Fetch Join 적용
- Graph : Entity Graph 적용
- Original : 프로젝트 끝날 때 상태 (일부 Fetch Join 적용됨)
쿼리 분석 결과
(1)1회차
========================================================================================================================
API 버전 비교 분석 보고서
========================================================================================================================

1. 요약 정보

---

분석 대상 API 버전: 4개

- original: /api/v1/protections/my-cases (호출 횟수: 1회)
- pure: /api/v1/protections/pure/my-cases (호출 횟수: 1회)
- optimized: /api/v1/protections/optimized/my-cases (호출 횟수: 1회)
- graph: /api/v1/protections/graph/my-cases (호출 횟수: 1회)

2. 회차별 응답 시간 비교

---

### 응답 시간 (ms)

응답 시간: original (667) / pure (124) / optimized (64) / graph (60)

### 쿼리 수

쿼리 수: original (606) / pure (106) / optimized (4) / graph (4)

### DB 접근 시간 (ms)

DB 시간: original (35.0) / pure (3.0) / optimized (27.0) / graph (20.0)

### 지연 로딩 횟수

지연 로딩: original (1212) / pure (1208) / optimized (1210) / graph (1210)

### 반복 쿼리 패턴 분석

#### original 버전 반복 쿼리:

1. 횟수: 497회
 전체 쿼리: select s1_0.id, s1_0.address, s1_0.business_registration_number, s1_0.created_at, s1_0.latitude, s1_0.longitude, s1_0.modified_at, s1_0.name, s1_0.closed_days, s1_0.weekday_time, s1_0.weekend_time, s1_0.owner, s1_0.save_target_animal, sm1_0.id, sm1_0.address, sm1_0.api_key, sm1_0.birth_date, sm1_0.created_at, sm1_0.email, sm1_0.gender, sm1_0.login_type, sm1_0.marketing_agree, sm1_0.modified_at, sm1_0.nickname, oap1_0.member_id, oap1_0.created_at, oap1_0.google_connected, oap1_0.google_connected_at, oap1_0.google_email, oap1_0.google_modified_at, oap1_0.google_provider_id, oap1_0.kakao_connected, oap1_0.kakao_connected_at, oap1_0.kakao_email, oap1_0.kakao_modified_at, oap1_0.kakao_provider_id, oap1_0.modified_at, oap1_0.naver_connected, oap1_0.naver_connected_at, oap1_0.naver_email, oap1_0.naver_modified_at, oap1_0.naver_provider_id, sm1_0.password, sm1_0.phone_number, sm1_0.profile_image_url, sm1_0.role, sm1_0.status, s1_0.tel, s1_0.vet_person_count from shelters s1_0 left join members sm1_0 on sm1_0.id=s1_0.member_id left join oauth_providers oap1_0 on sm1_0.id=oap1_0.member_id where s1_0.member_id=5
 ID 값들: 5, 5, 4, 6, 7, 8, 9, 10, 11, 12 외 487개...

2. 횟수: 100회
 전체 쿼리: select op1_0.member_id, op1_0.created_at, op1_0.google_connected, op1_0.google_connected_at, op1_0.google_email, op1_0.google_modified_at, op1_0.google_provider_id, op1_0.kakao_connected, op1_0.kakao_connected_at, op1_0.kakao_email, op1_0.kakao_modified_at, op1_0.kakao_provider_id, m1_0.id, m1_0.address, m1_0.api_key, m1_0.birth_date, m1_0.created_at, m1_0.email, m1_0.gender, m1_0.login_type, m1_0.marketing_agree, m1_0.modified_at, m1_0.nickname, m1_0.password, m1_0.phone_number, m1_0.profile_image_url, m1_0.role, s1_0.id, s1_0.address, s1_0.business_registration_number, s1_0.created_at, s1_0.latitude, s1_0.longitude, s1_0.modified_at, s1_0.name, s1_0.closed_days, s1_0.weekday_time, s1_0.weekend_time, s1_0.owner, s1_0.save_target_animal, s1_0.tel, s1_0.vet_person_count, m1_0.status, op1_0.modified_at, op1_0.naver_connected, op1_0.naver_connected_at, op1_0.naver_email, op1_0.naver_modified_at, op1_0.naver_provider_id from oauth_providers op1_0 join members m1_0 on m1_0.id=op1_0.member_id left join shelters s1_0 on m1_0.id=s1_0.member_id where op1_0.member_id=5
 ID 값들: 5, 4, 6, 7, 8, 9, 10, 11, 12, 13 외 90개...

3. 횟수: 2회
 전체 쿼리: select p1_0.id, p1_0.animal_case_id, p1_0.applicant_id, a1_0.id, a1_0.address, a1_0.api_key, a1_0.birth_date, a1_0.created_at, a1_0.email, a1_0.gender, a1_0.login_type, a1_0.marketing_agree, a1_0.modified_at, a1_0.nickname, a1_0.password, a1_0.phone_number, a1_0.profile_image_url, a1_0.role, a1_0.status, p1_0.approved_date, p1_0.created_at, p1_0.deleted_at, p1_0.modified_at, p1_0.protection_status, p1_0.protection_type, p1_0.reason, p1_0.reject_reason from protections p1_0 join members a1_0 on a1_0.id=p1_0.applicant_id where p1_0.animal_case_id=35 and p1_0.protection_status='PENDING' and p1_0.deleted_at is null
 ID 값들: 35, 34

4. 횟수: 2회
 전체 쿼리: select count(p1_0.id) from protections p1_0 left join animal_cases ac1_0 on ac1_0.id=p1_0.animal_case_id where ac1_0.id=35 and p1_0.protection_status='PENDING' and p1_0.deleted_at is null
 ID 값들: 35, 34

#### pure 버전 반복 쿼리:

1. 횟수: 100회
 전체 쿼리: select m1_0.id, m1_0.address, m1_0.api_key, m1_0.birth_date, m1_0.created_at, m1_0.email, m1_0.gender, m1_0.login_type, m1_0.marketing_agree, m1_0.modified_at, m1_0.nickname, oap1_0.member_id, oap1_0.created_at, oap1_0.google_connected, oap1_0.google_connected_at, oap1_0.google_email, oap1_0.google_modified_at, oap1_0.google_provider_id, oap1_0.kakao_connected, oap1_0.kakao_connected_at, oap1_0.kakao_email, oap1_0.kakao_modified_at, oap1_0.kakao_provider_id, oap1_0.modified_at, oap1_0.naver_connected, oap1_0.naver_connected_at, oap1_0.naver_email, oap1_0.naver_modified_at, oap1_0.naver_provider_id, m1_0.password, m1_0.phone_number, m1_0.profile_image_url, m1_0.role, s1_0.id, s1_0.address, s1_0.business_registration_number, s1_0.created_at, s1_0.latitude, s1_0.longitude, s1_0.modified_at, s1_0.name, s1_0.closed_days, s1_0.weekday_time, s1_0.weekend_time, s1_0.owner, s1_0.save_target_animal, s1_0.tel, s1_0.vet_person_count, m1_0.status from members m1_0 left join oauth_providers oap1_0 on m1_0.id=oap1_0.member_id left join shelters s1_0 on m1_0.id=s1_0.member_id where m1_0.id=4
 ID 값들: 4, 5, 6, 7, 8, 9, 10, 11, 12, 13 외 90개...

2. 횟수: 2회
 전체 쿼리: select a1_0.id, a1_0.animal_type, a1_0.breed, a1_0.created_at, a1_0.estimated_age, a1_0.feature, a1_0.gender, a1_0.health_condition, a1_0.image_url, a1_0.is_lost, a1_0.modified_at, a1_0.name, a1_0.owner_id, a1_0.registration_no, a1_0.size from animals a1_0 where a1_0.id=124
 ID 값들: 124, 96

#### optimized 버전 반복 쿼리:

반복 패턴 없음

#### graph 버전 반복 쿼리:

반복 패턴 없음

3. 성능 지표 요약

---

### 버전별 성능 비교 표:

| 성능 지표           | original | pure | optimized | graph |
| ------------------- | -------- | ---- | --------- | ----- |
| 응답 시간 (ms)      | 667      | 124  | 64        | 60    |
| 쿼리 수             | 606      | 106  | 4         | 4     |
| DB 시간 (ms)        | 35.0     | 3.0  | 27.0      | 20.0  |
| 지연 로딩           | 1212     | 1208 | 1210      | 1210  |
| 쿼리당 DB 시간 (ms) | 0.06     | 0.03 | 6.75      | 5.00  |

### 성능 지표별 최적 버전:

- 응답 시간: graph (60ms)
- 쿼리 효율성: optimized (4개)
- DB 효율성: pure (0.03ms/쿼리)
(2)2회차
========================================================================================================================
                                  API 버전 비교 분석 보고서
========================================================================================================================

1. 요약 정보
------------------------------------------------------------------------------------------------------------------------
분석 대상 API 버전: 4개
- original: /api/v1/protections/my-cases (호출 횟수: 1회)
- pure: /api/v1/protections/pure/my-cases (호출 횟수: 1회)
- optimized: /api/v1/protections/optimized/my-cases (호출 횟수: 1회)
- graph: /api/v1/protections/graph/my-cases (호출 횟수: 1회)

2. 회차별 응답 시간 비교
------------------------------------------------------------------------------------------------------------------------

### 응답 시간 (ms)
응답 시간: original (612) / pure (151) / optimized (65) / graph (61)

### 쿼리 수
쿼리 수: original (606) / pure (106) / optimized (4) / graph (4)

### DB 접근 시간 (ms)
DB 시간: original (30.0) / pure (4.0) / optimized (29.0) / graph (22.0)

### 지연 로딩 횟수
지연 로딩: original (1212) / pure (1208) / optimized (1210) / graph (1210)

### 반복 쿼리 패턴 분석

#### original 버전 반복 쿼리:
1. 횟수: 497회
  전체 쿼리: select s1_0.id, s1_0.address, s1_0.business_registration_number, s1_0.created_at, s1_0.latitude, s1_0.longitude, s1_0.modified_at, s1_0.name, s1_0.closed_days, s1_0.weekday_time, s1_0.weekend_time, s1_0.owner, s1_0.save_target_animal, sm1_0.id, sm1_0.address, sm1_0.api_key, sm1_0.birth_date, sm1_0.created_at, sm1_0.email, sm1_0.gender, sm1_0.login_type, sm1_0.marketing_agree, sm1_0.modified_at, sm1_0.nickname, oap1_0.member_id, oap1_0.created_at, oap1_0.google_connected, oap1_0.google_connected_at, oap1_0.google_email, oap1_0.google_modified_at, oap1_0.google_provider_id, oap1_0.kakao_connected, oap1_0.kakao_connected_at, oap1_0.kakao_email, oap1_0.kakao_modified_at, oap1_0.kakao_provider_id, oap1_0.modified_at, oap1_0.naver_connected, oap1_0.naver_connected_at, oap1_0.naver_email, oap1_0.naver_modified_at, oap1_0.naver_provider_id, sm1_0.password, sm1_0.phone_number, sm1_0.profile_image_url, sm1_0.role, sm1_0.status, s1_0.tel, s1_0.vet_person_count from shelters s1_0 left join members sm1_0 on sm1_0.id=s1_0.member_id left join oauth_providers oap1_0 on sm1_0.id=oap1_0.member_id where s1_0.member_id=5
  ID 값들: 5, 5, 4, 6, 7, 8, 9, 10, 11, 12 외 487개...

2. 횟수: 100회
  전체 쿼리: select op1_0.member_id, op1_0.created_at, op1_0.google_connected, op1_0.google_connected_at, op1_0.google_email, op1_0.google_modified_at, op1_0.google_provider_id, op1_0.kakao_connected, op1_0.kakao_connected_at, op1_0.kakao_email, op1_0.kakao_modified_at, op1_0.kakao_provider_id, m1_0.id, m1_0.address, m1_0.api_key, m1_0.birth_date, m1_0.created_at, m1_0.email, m1_0.gender, m1_0.login_type, m1_0.marketing_agree, m1_0.modified_at, m1_0.nickname, m1_0.password, m1_0.phone_number, m1_0.profile_image_url, m1_0.role, s1_0.id, s1_0.address, s1_0.business_registration_number, s1_0.created_at, s1_0.latitude, s1_0.longitude, s1_0.modified_at, s1_0.name, s1_0.closed_days, s1_0.weekday_time, s1_0.weekend_time, s1_0.owner, s1_0.save_target_animal, s1_0.tel, s1_0.vet_person_count, m1_0.status, op1_0.modified_at, op1_0.naver_connected, op1_0.naver_connected_at, op1_0.naver_email, op1_0.naver_modified_at, op1_0.naver_provider_id from oauth_providers op1_0 join members m1_0 on m1_0.id=op1_0.member_id left join shelters s1_0 on m1_0.id=s1_0.member_id where op1_0.member_id=5
  ID 값들: 5, 4, 6, 7, 8, 9, 10, 11, 12, 13 외 90개...

3. 횟수: 2회
  전체 쿼리: select p1_0.id, p1_0.animal_case_id, p1_0.applicant_id, a1_0.id, a1_0.address, a1_0.api_key, a1_0.birth_date, a1_0.created_at, a1_0.email, a1_0.gender, a1_0.login_type, a1_0.marketing_agree, a1_0.modified_at, a1_0.nickname, a1_0.password, a1_0.phone_number, a1_0.profile_image_url, a1_0.role, a1_0.status, p1_0.approved_date, p1_0.created_at, p1_0.deleted_at, p1_0.modified_at, p1_0.protection_status, p1_0.protection_type, p1_0.reason, p1_0.reject_reason from protections p1_0 join members a1_0 on a1_0.id=p1_0.applicant_id where p1_0.animal_case_id=35 and p1_0.protection_status='PENDING' and p1_0.deleted_at is null
  ID 값들: 35, 34

4. 횟수: 2회
  전체 쿼리: select count(p1_0.id) from protections p1_0 left join animal_cases ac1_0 on ac1_0.id=p1_0.animal_case_id where ac1_0.id=35 and p1_0.protection_status='PENDING' and p1_0.deleted_at is null
  ID 값들: 35, 34

#### pure 버전 반복 쿼리:
1. 횟수: 100회
  전체 쿼리: select m1_0.id, m1_0.address, m1_0.api_key, m1_0.birth_date, m1_0.created_at, m1_0.email, m1_0.gender, m1_0.login_type, m1_0.marketing_agree, m1_0.modified_at, m1_0.nickname, oap1_0.member_id, oap1_0.created_at, oap1_0.google_connected, oap1_0.google_connected_at, oap1_0.google_email, oap1_0.google_modified_at, oap1_0.google_provider_id, oap1_0.kakao_connected, oap1_0.kakao_connected_at, oap1_0.kakao_email, oap1_0.kakao_modified_at, oap1_0.kakao_provider_id, oap1_0.modified_at, oap1_0.naver_connected, oap1_0.naver_connected_at, oap1_0.naver_email, oap1_0.naver_modified_at, oap1_0.naver_provider_id, m1_0.password, m1_0.phone_number, m1_0.profile_image_url, m1_0.role, s1_0.id, s1_0.address, s1_0.business_registration_number, s1_0.created_at, s1_0.latitude, s1_0.longitude, s1_0.modified_at, s1_0.name, s1_0.closed_days, s1_0.weekday_time, s1_0.weekend_time, s1_0.owner, s1_0.save_target_animal, s1_0.tel, s1_0.vet_person_count, m1_0.status from members m1_0 left join oauth_providers oap1_0 on m1_0.id=oap1_0.member_id left join shelters s1_0 on m1_0.id=s1_0.member_id where m1_0.id=4
  ID 값들: 4, 5, 6, 7, 8, 9, 10, 11, 12, 13 외 90개...

2. 횟수: 2회
  전체 쿼리: select a1_0.id, a1_0.animal_type, a1_0.breed, a1_0.created_at, a1_0.estimated_age, a1_0.feature, a1_0.gender, a1_0.health_condition, a1_0.image_url, a1_0.is_lost, a1_0.modified_at, a1_0.name, a1_0.owner_id, a1_0.registration_no, a1_0.size from animals a1_0 where a1_0.id=124
  ID 값들: 124, 96

#### optimized 버전 반복 쿼리:
반복 패턴 없음

#### graph 버전 반복 쿼리:
반복 패턴 없음

3. 성능 지표 요약
------------------------------------------------------------------------------------------------------------------------

### 버전별 성능 비교 표:
| 성능 지표 | original | pure | optimized | graph |
| --- | --- | --- | --- | --- |
| 응답 시간 (ms) | 612 | 151 | 65 | 61 |
| 쿼리 수 | 606 | 106 | 4 | 4 |
| DB 시간 (ms) | 30.0 | 4.0 | 29.0 | 22.0 |
| 지연 로딩 | 1212 | 1208 | 1210 | 1210 |
| 쿼리당 DB 시간 (ms) | 0.05 | 0.04 | 7.25 | 5.50 |

### 성능 지표별 최적 버전:
- 응답 시간: graph (61ms)
- 쿼리 효율성: optimized (4개)
- DB 효율성: pure (0.04ms/쿼리)
K6 부하 테스트 결과
(1)K6 시나리오 설명
(주의 !) P6Spy나 다른 로그 시스템을 끄지 않고 K6 테스트를 로컬에서 하는 경우 메모리 부족이 생길 수 있다.
- 대량의 쿼리가 발생 ⇒ P6Spy의 로깅 처리 ⇒ CPU, 메모리 사용 증가 및 로그 파일 생성으로 디스크 I/O 증가
- 로깅 작업 자체도 많은 임시 객체를 생성한다. ⇒ JVM Heap에 영향을 준다.
- 디스크 I/O 증가는 CPU, 메모리 등 전반적으로 영향을 많이 준다.
- 소규모 데이터에선 영향이 크지 않다.
- K6 시나리오
- 사용자 로그인
- 시작 : 5명의 동시 사용자로 10초간 진행
- 단계적 증가 : 20명 → 50명 → 100명으로 각 30초씩 증가
- 최대 부하 유지 : 100명의 사용자로 30초간 유지
- 마무리 : 5명으로 감소하여 10초간 진행
(2)
Original 버전
1회차
요약 ========================================================= 총 요청 수: 1293 테스트 기간:
144.5080954초 TPS (초당 트랜잭션): 8.95

응답 시간 (ms): - 평균: 4839.49 - 최소: 74.04 - 중앙값: 4835.13 - 최대: 11751.30 - p90: 8656.85 - p95: 8761.43 - p99: 9061.41 - p99.9: 11431.17

# 실패율: 0.00%

{
"apiVersion": "original",
"summary": {
"totalRequests": 1293,
"testDuration": 144.5080954,
"tps": 8.947595609927331
},
"responseTime": {
"avg": 4839.488207811287,
"min": 74.0397,
"med": 4835.1302,
"max": 11751.3033,
"p90": 8656.8482,
"p95": 8761.42644,
"p99": 9061.411408
},
"failRate": 0,
"vus_max": 100,
"http_req_waiting": 4834.4324136890955,
"http_req_connecting": 0.08128298530549113,
"http_req_sending": 0.01744694508894045,
"http_req_receiving": 5.038347177107495
}

running (2m24.5s), 000/100 VUs, 1292 complete and 0 interrupted iterations
 default ✓ [======================================] 000/100 VUs 2m20s
 ERRO[0144] thresholds on metrics 'http_req_duration' have been crossed
2회차
=========================================================
            original 버전 성능 테스트 결과 요약
=========================================================
총 요청 수: 1316
테스트 기간: 145.5648495초
TPS (초당 트랜잭션): 9.04

응답 시간 (ms):
  - 평균: 4784.51
  - 최소: 106.65
  - 중앙값: 5054.45
  - 최대: 13653.24
  - p90: 8487.24
  - p95: 8638.29
  - p99: 8929.36
  - p99.9: 13458.03

실패율: 0.00%
=========================================================

{
    "apiVersion": "original",
    "summary": {
        "totalRequests": 1316,
        "testDuration": 145.5648495,
        "tps": 9.04064411511654
    },
    "responseTime": {
        "avg": 4784.509185410341,
        "min": 106.6501,
        "med": 5054.44915,
        "max": 13653.2389,
        "p90": 8487.2361,
        "p95": 8638.293675,
        "p99": 8929.362795000001
    },
    "failRate": 0,
    "vus_max": 100,
    "http_req_waiting": 4779.58684430091,
    "http_req_connecting": 0.08308107902735565,
    "http_req_sending": 0.021197948328267484,
    "http_req_receiving": 4.901143161094228
}

running (2m25.6s), 000/100 VUs, 1315 complete and 0 interrupted iterations
default ✓ [======================================] 000/100 VUs  2m20s
ERRO[0145] thresholds on metrics 'http_req_duration' have been crossed
3회차
=========================================================
            original 버전 성능 테스트 결과 요약
=========================================================
총 요청 수: 1301
테스트 기간: 145.18363570000002초
TPS (초당 트랜잭션): 8.96

응답 시간 (ms):
  - 평균: 4883.16
  - 최소: 75.70
  - 중앙값: 4606.42
  - 최대: 13123.87
  - p90: 8708.42
  - p95: 8825.81
  - p99: 9006.21
  - p99.9: 11903.30

실패율: 0.00%
=========================================================

{
    "apiVersion": "original",
    "summary": {
        "totalRequests": 1301,
        "testDuration": 145.18363570000002,
        "tps": 8.961065024492976
    },
    "responseTime": {
        "avg": 4883.161229669489,
        "min": 75.6957,
        "med": 4606.4206,
        "max": 13123.8742,
        "p90": 8708.421,
        "p95": 8825.8065,
        "p99": 9006.2129
    },
    "failRate": 0,
    "vus_max": 100,
    "http_req_waiting": 4878.084835203688,
    "http_req_connecting": 0.07248262874711761,
    "http_req_sending": 0.022437970791698698,
    "http_req_receiving": 5.05395649500384
}

running (2m25.2s), 000/100 VUs, 1300 complete and 0 interrupted iterations
default ✓ [======================================] 000/100 VUs  2m20s
ERRO[0145] thresholds on metrics 'http_req_duration' have been crossed
(3)
Pure 버전
1회차
========================================================= 총 요청 수: 4263 테스트 기간:
141.2374426초 TPS (초당 트랜잭션): 30.18

응답 시간 (ms): - 평균: 706.22 - 최소: 74.02 - 중앙값: 657.04 - 최대: 2102.12 - p90: 1314.98 - p95: 1372.09 - p99: 1501.14 - p99.9: 1835.63

# 실패율: 0.00%

{
"apiVersion": "pure",
"summary": {
"totalRequests": 4263,
"testDuration": 141.2374426,
"tps": 30.18321431996815
},
"responseTime": {
"avg": 706.2209547970921,
"min": 74.0204,
"med": 657.0417,
"max": 2102.1162,
"p90": 1314.98366,
"p95": 1372.0888999999997,
"p99": 1501.1403520000003
},
"failRate": 0,
"vus_max": 100,
"http_req_waiting": 701.2579259910858,
"http_req_connecting": 0.02277267182735163,
"http_req_sending": 0.025264532019704435,
"http_req_receiving": 4.937764273985463
}

running (2m21.2s), 000/100 VUs, 4262 complete and 0 interrupted iterations
 default ✓ [======================================] 000/100 VUs 2m20s
 ERRO[0141] thresholds on metrics 'http_req_duration' have been crossed
2회차
=========================================================
            pure 버전 성능 테스트 결과 요약
=========================================================
총 요청 수: 4215
테스트 기간: 141.2345661초
TPS (초당 트랜잭션): 29.84

응답 시간 (ms):
  - 평균: 711.81
  - 최소: 75.03
  - 중앙값: 621.26
  - 최대: 2208.09
  - p90: 1371.60
  - p95: 1432.74
  - p99: 1575.30
  - p99.9: 1940.99

실패율: 0.00%
=========================================================

{
    "apiVersion": "pure",
    "summary": {
        "totalRequests": 4215,
        "testDuration": 141.2345661,
        "tps": 29.843968912083486
    },
    "responseTime": {
        "avg": 711.814761850533,
        "min": 75.035,
        "med": 621.2615,
        "max": 2208.0866,
        "p90": 1371.5959799999998,
        "p95": 1432.7444199999998,
        "p99": 1575.3033159999998
    },
    "failRate": 0,
    "vus_max": 100,
    "http_req_waiting": 706.8338201423479,
    "http_req_connecting": 0.025746049822064056,
    "http_req_sending": 0.028515136417556347,
    "http_req_receiving": 4.952426571767491
}

running (2m21.2s), 000/100 VUs, 4214 complete and 0 interrupted iterations
default ✓ [======================================] 000/100 VUs  2m20s
ERRO[0141] thresholds on metrics 'http_req_duration' have been crossed
3회차
========================================================= 총 요청 수: 5508 테스트 기간:
141.4042343초 TPS (초당 트랜잭션): 38.95

응답 시간 (ms): - 평균: 302.57 - 최소: 75.00 - 중앙값: 243.39 - 최대: 813.35 - p90: 547.49 - p95: 575.35 - p99: 626.41 - p99.9: 736.72

# 실패율: 0.00%

{
"apiVersion": "pure",
"summary": {
"totalRequests": 5508,
"testDuration": 141.4042343,
"tps": 38.95215746025223
},
"responseTime": {
"avg": 302.57334889252087,
"min": 75.0032,
"med": 243.39315,
"max": 813.3536,
"p90": 547.48649,
"p95": 575.3498599999999,
"p99": 626.4059710000005
},
"failRate": 0,
"vus_max": 100,
"http_req_waiting": 299.04384468046464,
"http_req_connecting": 0.01621721132897603,
"http_req_sending": 0.010236837327523604,
"http_req_receiving": 3.519267374727667
}

running (2m21.4s), 000/100 VUs, 5507 complete and 0 interrupted iterations
 default ✓ [======================================] 000/100 VUs 2m20s
(4)Optimized 버전
1회차
=========================================================
            optimized 버전 성능 테스트 결과 요약
=========================================================
총 요청 수: 6799
테스트 기간: 140.814921초
TPS (초당 트랜잭션): 48.28

응답 시간 (ms):
  - 평균: 56.17
  - 최소: 30.93
  - 중앙값: 52.75
  - 최대: 301.59
  - p90: 74.15
  - p95: 85.40
  - p99: 129.95
  - p99.9: 229.05

실패율: 0.00%
=========================================================

{
    "apiVersion": "optimized",
    "summary": {
        "totalRequests": 6799,
        "testDuration": 140.814921,
        "tps": 48.283235552857356
    },
    "responseTime": {
        "avg": 56.168705574349204,
        "min": 30.9335,
        "med": 52.7462,
        "max": 301.592,
        "p90": 74.15447999999999,
        "p95": 85.40469999999999,
        "p99": 129.94765999999993
    },
    "failRate": 0,
    "vus_max": 100,
    "http_req_waiting": 52.6994456537727,
    "http_req_connecting": 0.013416340638329164,
    "http_req_sending": 0.096093984409472,
    "http_req_receiving": 3.373165936167086
}

running (2m20.8s), 000/100 VUs, 6798 complete and 0 interrupted iterations
default ✓ [======================================] 000/100 VUs  2m20s
2회차
요약 ========================================================= 총 요청 수: 6804 테스트 기간:
141.4609179초 TPS (초당 트랜잭션): 48.10

응답 시간 (ms): - 평균: 54.19 - 최소: 31.30 - 중앙값: 52.75 - 최대: 118.12 - p90: 72.42 - p95: 78.43 - p99: 93.39 - p99.9: 109.87

# 실패율: 0.00%

{
"apiVersion": "optimized",
"summary": {
"totalRequests": 6804,
"testDuration": 141.4609179,
"tps": 48.098090278261935
},
"responseTime": {
"avg": 54.19110224867721,
"min": 31.3023,
"med": 52.74515,
"max": 118.1236,
"p90": 72.41583,
"p95": 78.42630499999997,
"p99": 93.387644
},
"failRate": 0,
"vus_max": 100,
"http_req_waiting": 51.35318821281595,
"http_req_connecting": 0.011147898295120513,
"http_req_sending": 0.007533965314520868,
"http_req_receiving": 2.830380070546743
}

running (2m21.5s), 000/100 VUs, 6803 complete and 0 interrupted iterations
 default ✓ [======================================] 000/100 VUs 2m20s
3회차
=========================================================
            optimized 버전 성능 테스트 결과 요약
=========================================================
총 요청 수: 6822
테스트 기간: 141.38246859999998초
TPS (초당 트랜잭션): 48.25

응답 시간 (ms):
  - 평균: 53.96
  - 최소: 30.16
  - 중앙값: 52.90
  - 최대: 124.54
  - p90: 70.81
  - p95: 76.33
  - p99: 89.68
  - p99.9: 111.81

실패율: 0.00%
=========================================================

{
    "apiVersion": "optimized",
    "summary": {
        "totalRequests": 6822,
        "testDuration": 141.38246859999998,
        "tps": 48.25209283408991
    },
    "responseTime": {
        "avg": 53.95577254470818,
        "min": 30.1571,
        "med": 52.8969,
        "max": 124.5384,
        "p90": 70.80501000000001,
        "p95": 76.33096499999999,
        "p99": 89.67722199999999
    },
    "failRate": 0,
    "vus_max": 100,
    "http_req_waiting": 51.064962620932064,
    "http_req_connecting": 0.011302946350043983,
    "http_req_sending": 0.005662019935502785,
    "http_req_receiving": 2.885147903840512
}

running (2m21.4s), 000/100 VUs, 6821 complete and 0 interrupted iterations
default ✓ [======================================] 000/100 VUs  2m20s
(5)
Graph 버전
1회차
========================================================= 총 요청 수: 6836 테스트 기간:
141.1049852초 TPS (초당 트랜잭션): 48.45

응답 시간 (ms): - 평균: 46.11 - 최소: 26.51 - 중앙값: 44.84 - 최대: 126.90 - p90: 60.94 - p95: 66.13 - p99: 82.07 - p99.9: 111.78

# 실패율: 0.00%

{
"apiVersion": "graph",
"summary": {
"totalRequests": 6836,
"testDuration": 141.1049852,
"tps": 48.44619763299476
},
"responseTime": {
"avg": 46.11168627852544,
"min": 26.5052,
"med": 44.842,
"max": 126.9013,
"p90": 60.941050000000004,
"p95": 66.1298,
"p99": 82.07030499999995
},
"failRate": 0,
"vus_max": 100,
"http_req_waiting": 43.394919660620175,
"http_req_connecting": 0.010750482738443534,
"http_req_sending": 0.005903086600351083,
"http_req_receiving": 2.710863531304846
}

running (2m21.1s), 000/100 VUs, 6835 complete and 0 interrupted iterations
 default ✓ [======================================] 000/100 VUs 2m20s
2회차
=========================================================
            graph 버전 성능 테스트 결과 요약
=========================================================
총 요청 수: 6853
테스트 기간: 141.4831346초
TPS (초당 트랜잭션): 48.44

응답 시간 (ms):
  - 평균: 47.21
  - 최소: 26.88
  - 중앙값: 46.19
  - 최대: 108.94
  - p90: 62.29
  - p95: 66.57
  - p99: 77.79
  - p99.9: 95.35

실패율: 0.00%
=========================================================

{
    "apiVersion": "graph",
    "summary": {
        "totalRequests": 6853,
        "testDuration": 141.4831346,
        "tps": 48.43686860186373
    },
    "responseTime": {
        "avg": 47.21255578578731,
        "min": 26.8777,
        "med": 46.1934,
        "max": 108.9434,
        "p90": 62.28804,
        "p95": 66.56797999999998,
        "p99": 77.78984799999992
    },
    "failRate": 0,
    "vus_max": 100,
    "http_req_waiting": 44.339399518459054,
    "http_req_connecting": 0.01001005399095287,
    "http_req_sending": 0.006254808113235081,
    "http_req_receiving": 2.8669014592149407
}

running (2m21.5s), 000/100 VUs, 6852 complete and 0 interrupted iterations
default ✓ [======================================] 000/100 VUs  2m20s
3회차
========================================================= 총 요청 수: 6866 테스트 기간:
140.8413168초 TPS (초당 트랜잭션): 48.75

응답 시간 (ms): - 평균: 47.52 - 최소: 27.52 - 중앙값: 46.48 - 최대: 129.39 - p90: 62.40 - p95: 66.47 - p99: 77.08 - p99.9: 102.90

# 실패율: 0.00%

{
"apiVersion": "graph",
"summary": {
"totalRequests": 6866,
"testDuration": 140.8413168,
"tps": 48.74989921991414
},
"responseTime": {
"avg": 47.52368461986581,
"min": 27.52,
"med": 46.47945,
"max": 129.3861,
"p90": 62.397450000000006,
"p95": 66.4721,
"p99": 77.0788
},
"failRate": 0,
"vus_max": 100,
"http_req_waiting": 44.67966514710186,
"http_req_connecting": 0.010563180891348672,
"http_req_sending": 0.005825837459947567,
"http_req_receiving": 2.8381936353043997
}

running (2m20.8s), 000/100 VUs, 6865 complete and 0 interrupted iterations
 default ✓ [======================================] 000/100 VUs 2m20s
GC 로그 분석 결과
(1)Original 버전
1회차
============================================
        GC-API 상관관계 분석 보고서
============================================

분석 시간: 2025-05-02 14:26:31
로그 파일: results\temp_original_case1_log.txt

## 1. GC 통계
GC 발생 횟수: 149
총 GC 소요 시간: 950.85ms
평균 GC 시간: 6.38ms
최대 GC 일시 정지 시간: 10.13ms
총 회수 메모리량: 39154MB
평균 메모리 회수량: 262.78MB
테스트 기간: 139.95초
초당 GC 발생 수: 1.0646
분당 GC 발생 수: 63.88

GC 유형별 발생 횟수:
  - Young (Normal) (G1 Evacuation Pause): 149

## 2. API 통계 (GC 추출)
API 요청 수: 1292
총 API 실행 시간: 4401765.00ms
평균 API 응답 시간: 3406.94ms
최소 API 응답 시간: 382.00ms
최대 API 응답 시간: 9032.00ms
테스트 기간: 143.23초
TPS(초당 트랜잭션): 9.02
P90 응답 시간: 6403.00ms
P95 응답 시간: 6958.35ms
P99 응답 시간: 7694.27ms

API 상태 코드 분포:
  - 200: 1292

API 버전 분포:
  - original: 1292

## 3. K6 성능 지표
API 버전: original
총 요청 수: 1293
테스트 기간: 144.51초
TPS: 8.95
평균 응답 시간: 4839.49ms
최소 응답 시간: 74.04ms
중간값 응답 시간: 4835.13ms
최대 응답 시간: 11751.30ms
P90 응답 시간: 8656.85ms
P95 응답 시간: 8761.43ms
P99 응답 시간: 9061.41ms
실패율: 0.00%
최대 가상 사용자 수: 100

HTTP 요청 상세 시간:
  - 대기 시간(waiting): 4834.43ms
  - 연결 시간(connecting): 0.08ms
  - 송신 시간(sending): 0.02ms
  - 수신 시간(receiving): 5.04ms

## 4. GC-API 상관관계 분석
API 호출 중 발생한 GC 수: 148
GC 발생 API 요청 수: 1201
GC 미발생 API 요청 수: 91
전체 API 대비 GC 발생 API 비율: 92.96%

응답 시간 비교:
  - GC 발생 API 평균 응답 시간: 3618.66ms
  - GC 미발생 API 평균 응답 시간: 612.67ms
  - 응답 시간 차이: 3005.99ms
  - GC 영향 비율: 490.64%

백분위 응답 시간 비교:
  - GC 발생 API P95 응답 시간: 7054.00ms
  - GC 미발생 API P95 응답 시간: 823.50ms

최소/최대 응답 시간 비교:
  - GC 발생 API 최소 응답 시간: 399.00ms
  - GC 미발생 API 최소 응답 시간: 382.00ms
  - GC 발생 API 최대 응답 시간: 9032.00ms
  - GC 미발생 API 최대 응답 시간: 932.00ms

## 5. 효율성 지표
요청당 GC 발생 비율: 0.115325
요청당 메모리 회수량: 30.30MB
총 실행 시간 대비 GC 소요 시간 비율: 0.02%
TPS당 GC 발생 수: 16.52

K6 결과 비교:
로그 파싱 API 요청 / K6 총 요청 비율: 99.92%
로그 파싱 평균 응답 시간 / K6 평균 응답 시간 비율: 70.40%
2회차
============================================

분석 시간: 2025-05-02 14:30:06
로그 파일: results\temp_original_case1_log.txt

## 1. GC 통계

GC 발생 횟수: 152
총 GC 소요 시간: 990.28ms
평균 GC 시간: 6.51ms
최대 GC 일시 정지 시간: 18.86ms
총 회수 메모리량: 39946MB
평균 메모리 회수량: 262.80MB
테스트 기간: 154.64초
초당 GC 발생 수: 0.9829
분당 GC 발생 수: 58.98

GC 유형별 발생 횟수: - Young (Normal) (G1 Evacuation Pause): 152

## 2. API 통계 (GC 추출)

API 요청 수: 1314
총 API 실행 시간: 4013581.00ms
평균 API 응답 시간: 3054.48ms
최소 API 응답 시간: 399.00ms
최대 API 응답 시간: 8699.00ms
테스트 기간: 144.19초
TPS(초당 트랜잭션): 9.11
P90 응답 시간: 6371.50ms
P95 응답 시간: 7217.50ms
P99 응답 시간: 8121.35ms

API 상태 코드 분포: - 200: 1314

API 버전 분포: - original: 1314

## 3. K6 성능 지표

API 버전: original
총 요청 수: 1316
테스트 기간: 145.56초
TPS: 9.04
평균 응답 시간: 4784.51ms
최소 응답 시간: 106.65ms
중간값 응답 시간: 5054.45ms
최대 응답 시간: 13653.24ms
P90 응답 시간: 8487.24ms
P95 응답 시간: 8638.29ms
P99 응답 시간: 8929.36ms
실패율: 0.00%
최대 가상 사용자 수: 100

HTTP 요청 상세 시간: - 대기 시간(waiting): 4779.59ms - 연결 시간(connecting): 0.08ms - 송신 시간(sending): 0.02ms - 수신 시간(receiving): 4.90ms

## 4. GC-API 상관관계 분석

API 호출 중 발생한 GC 수: 151
GC 발생 API 요청 수: 1230
GC 미발생 API 요청 수: 84
전체 API 대비 GC 발생 API 비율: 93.61%

응답 시간 비교: - GC 발생 API 평균 응답 시간: 3222.69ms - GC 미발생 API 평균 응답 시간: 591.36ms - 응답 시간 차이: 2631.33ms - GC 영향 비율: 444.96%

백분위 응답 시간 비교: - GC 발생 API P95 응답 시간: 7281.25ms - GC 미발생 API P95 응답 시간: 777.90ms

최소/최대 응답 시간 비교: - GC 발생 API 최소 응답 시간: 460.00ms - GC 미발생 API 최소 응답 시간: 399.00ms - GC 발생 API 최대 응답 시간: 8699.00ms - GC 미발생 API 최대 응답 시간: 921.00ms

## 5. 효율성 지표

요청당 GC 발생 비율: 0.115677
요청당 메모리 회수량: 30.40MB
총 실행 시간 대비 GC 소요 시간 비율: 0.02%
TPS당 GC 발생 수: 16.68

K6 결과 비교:
로그 파싱 API 요청 / K6 총 요청 비율: 99.85%
로그 파싱 평균 응답 시간 / K6 평균 응답 시간 비율: 63.84%
3회차
============================================
        GC-API 상관관계 분석 보고서
============================================

분석 시간: 2025-05-02 14:34:13
로그 파일: results\temp_original_case1_log.txt

## 1. GC 통계
GC 발생 횟수: 150
총 GC 소요 시간: 959.07ms
평균 GC 시간: 6.39ms
최대 GC 일시 정지 시간: 10.32ms
총 회수 메모리량: 39408MB
평균 메모리 회수량: 262.72MB
테스트 기간: 138.58초
초당 GC 발생 수: 1.0824
분당 GC 발생 수: 64.94

GC 유형별 발생 횟수:
  - Young (Normal) (G1 Evacuation Pause): 150

## 2. API 통계 (GC 추출)
API 요청 수: 1300
총 API 실행 시간: 4597005.00ms
평균 API 응답 시간: 3536.16ms
최소 API 응답 시간: 383.00ms
최대 API 응답 시간: 10515.00ms
테스트 기간: 144.03초
TPS(초당 트랜잭션): 9.03
P90 응답 시간: 6608.30ms
P95 응답 시간: 6971.05ms
P99 응답 시간: 7626.10ms

API 상태 코드 분포:
  - 200: 1300

API 버전 분포:
  - original: 1300

## 3. K6 성능 지표
API 버전: original
총 요청 수: 1301
테스트 기간: 145.18초
TPS: 8.96
평균 응답 시간: 4883.16ms
최소 응답 시간: 75.70ms
중간값 응답 시간: 4606.42ms
최대 응답 시간: 13123.87ms
P90 응답 시간: 8708.42ms
P95 응답 시간: 8825.81ms
P99 응답 시간: 9006.21ms
실패율: 0.00%
최대 가상 사용자 수: 100

HTTP 요청 상세 시간:
  - 대기 시간(waiting): 4878.08ms
  - 연결 시간(connecting): 0.07ms
  - 송신 시간(sending): 0.02ms
  - 수신 시간(receiving): 5.05ms

## 4. GC-API 상관관계 분석
API 호출 중 발생한 GC 수: 150
GC 발생 API 요청 수: 1221
GC 미발생 API 요청 수: 79
전체 API 대비 GC 발생 API 비율: 93.92%

응답 시간 비교:
  - GC 발생 API 평균 응답 시간: 3726.69ms
  - GC 미발생 API 평균 응답 시간: 591.30ms
  - 응답 시간 차이: 3135.39ms
  - GC 영향 비율: 530.25%

백분위 응답 시간 비교:
  - GC 발생 API P95 응답 시간: 6976.00ms
  - GC 미발생 API P95 응답 시간: 766.00ms

최소/최대 응답 시간 비교:
  - GC 발생 API 최소 응답 시간: 397.00ms
  - GC 미발생 API 최소 응답 시간: 383.00ms
  - GC 발생 API 최대 응답 시간: 10515.00ms
  - GC 미발생 API 최대 응답 시간: 791.00ms

## 5. 효율성 지표
요청당 GC 발생 비율: 0.115385
요청당 메모리 회수량: 30.31MB
총 실행 시간 대비 GC 소요 시간 비율: 0.02%
TPS당 GC 발생 수: 16.62

K6 결과 비교:
로그 파싱 API 요청 / K6 총 요청 비율: 99.92%
로그 파싱 평균 응답 시간 / K6 평균 응답 시간 비율: 72.42%
(2)
Pure 버전
1회차
============================================

분석 시간: 2025-05-02 14:16:12
로그 파일: results\temp_pure_case1_log.txt

## 1. GC 통계

GC 발생 횟수: 185
총 GC 소요 시간: 870.80ms
평균 GC 시간: 4.71ms
최대 GC 일시 정지 시간: 14.09ms
총 회수 메모리량: 49828MB
평균 메모리 회수량: 269.34MB
테스트 기간: 137.00초
초당 GC 발생 수: 1.3504
분당 GC 발생 수: 81.02

GC 유형별 발생 횟수: - Young (Normal) (G1 Evacuation Pause): 185

## 2. API 통계 (GC 추출)

API 요청 수: 5504
총 API 실행 시간: 1304428.00ms
평균 API 응답 시간: 237.00ms
최소 API 응답 시간: 71.00ms
최대 API 응답 시간: 716.00ms
테스트 기간: 140.04초
TPS(초당 트랜잭션): 39.30
P90 응답 시간: 424.00ms
P95 응답 시간: 459.00ms
P99 응답 시간: 518.00ms

API 상태 코드 분포: - 200: 5504

API 버전 분포: - pure: 5504

## 3. K6 성능 지표

API 버전: pure
총 요청 수: 5508
테스트 기간: 141.40초
TPS: 38.95
평균 응답 시간: 302.57ms
최소 응답 시간: 75.00ms
중간값 응답 시간: 243.39ms
최대 응답 시간: 813.35ms
P90 응답 시간: 547.49ms
P95 응답 시간: 575.35ms
P99 응답 시간: 626.41ms
실패율: 0.00%
최대 가상 사용자 수: 100

HTTP 요청 상세 시간: - 대기 시간(waiting): 299.04ms - 연결 시간(connecting): 0.02ms - 송신 시간(sending): 0.01ms - 수신 시간(receiving): 3.52ms

## 4. GC-API 상관관계 분석

API 호출 중 발생한 GC 수: 185
GC 발생 API 요청 수: 2733
GC 미발생 API 요청 수: 2771
전체 API 대비 GC 발생 API 비율: 49.65%

응답 시간 비교: - GC 발생 API 평균 응답 시간: 318.99ms - GC 미발생 API 평균 응답 시간: 156.12ms - 응답 시간 차이: 162.87ms - GC 영향 비율: 104.32%

백분위 응답 시간 비교: - GC 발생 API P95 응답 시간: 488.80ms - GC 미발생 API P95 응답 시간: 329.00ms

최소/최대 응답 시간 비교: - GC 발생 API 최소 응답 시간: 79.00ms - GC 미발생 API 최소 응답 시간: 71.00ms - GC 발생 API 최대 응답 시간: 716.00ms - GC 미발생 API 최대 응답 시간: 440.00ms

## 5. 효율성 지표

요청당 GC 발생 비율: 0.033612
요청당 메모리 회수량: 9.05MB
총 실행 시간 대비 GC 소요 시간 비율: 0.07%
TPS당 GC 발생 수: 4.71

K6 결과 비교:
로그 파싱 API 요청 / K6 총 요청 비율: 99.93%
로그 파싱 평균 응답 시간 / K6 평균 응답 시간 비율: 78.33%
2회차
============================================
        GC-API 상관관계 분석 보고서
============================================

분석 시간: 2025-05-02 14:04:37
로그 파일: results\temp_pure_case1_log.txt

## 1. GC 통계
GC 발생 횟수: 144
총 GC 소요 시간: 892.05ms
평균 GC 시간: 6.19ms
최대 GC 일시 정지 시간: 13.77ms
총 회수 메모리량: 38643MB
평균 메모리 회수량: 268.35MB
테스트 기간: 167.11초
초당 GC 발생 수: 0.8617
분당 GC 발생 수: 51.70

GC 유형별 발생 횟수:
  - Young (Normal) (G1 Evacuation Pause): 144

## 2. API 통계 (GC 추출)
API 요청 수: 4257
총 API 실행 시간: 2207543.00ms
평균 API 응답 시간: 518.57ms
최소 API 응답 시간: 70.00ms
최대 API 응답 시간: 1771.00ms
테스트 기간: 139.94초
TPS(초당 트랜잭션): 30.42
P90 응답 시간: 964.00ms
P95 응답 시간: 1041.00ms
P99 응답 시간: 1192.88ms

API 상태 코드 분포:
  - 200: 4257

API 버전 분포:
  - pure: 4257

## 3. K6 성능 지표
API 버전: pure
총 요청 수: 4263
테스트 기간: 141.24초
TPS: 30.18
평균 응답 시간: 706.22ms
최소 응답 시간: 74.02ms
중간값 응답 시간: 657.04ms
최대 응답 시간: 2102.12ms
P90 응답 시간: 1314.98ms
P95 응답 시간: 1372.09ms
P99 응답 시간: 1501.14ms
실패율: 0.00%
최대 가상 사용자 수: 100

HTTP 요청 상세 시간:
  - 대기 시간(waiting): 701.26ms
  - 연결 시간(connecting): 0.02ms
  - 송신 시간(sending): 0.03ms
  - 수신 시간(receiving): 4.94ms

## 4. GC-API 상관관계 분석
API 호출 중 발생한 GC 수: 143
GC 발생 API 요청 수: 2707
GC 미발생 API 요청 수: 1550
전체 API 대비 GC 발생 API 비율: 63.59%

응답 시간 비교:
  - GC 발생 API 평균 응답 시간: 697.97ms
  - GC 미발생 API 평균 응답 시간: 205.25ms
  - 응답 시간 차이: 492.71ms
  - GC 영향 비율: 240.05%

백분위 응답 시간 비교:
  - GC 발생 API P95 응답 시간: 1093.70ms
  - GC 미발생 API P95 응답 시간: 458.55ms

최소/최대 응답 시간 비교:
  - GC 발생 API 최소 응답 시간: 76.00ms
  - GC 미발생 API 최소 응답 시간: 70.00ms
  - GC 발생 API 최대 응답 시간: 1771.00ms
  - GC 미발생 API 최대 응답 시간: 743.00ms

## 5. 효율성 지표
요청당 GC 발생 비율: 0.033827
요청당 메모리 회수량: 9.08MB
총 실행 시간 대비 GC 소요 시간 비율: 0.04%
TPS당 GC 발생 수: 4.73

K6 결과 비교:
로그 파싱 API 요청 / K6 총 요청 비율: 99.86%
로그 파싱 평균 응답 시간 / K6 평균 응답 시간 비율: 73.43%
3회차
============================================

분석 시간: 2025-05-02 14:09:30
로그 파일: results\temp_pure_case1_log.txt

## 1. GC 통계

GC 발생 횟수: 143
총 GC 소요 시간: 926.24ms
평균 GC 시간: 6.48ms
최대 GC 일시 정지 시간: 17.92ms
총 회수 메모리량: 38346MB
평균 메모리 회수량: 268.15MB
테스트 기간: 169.78초
초당 GC 발생 수: 0.8422
분당 GC 발생 수: 50.53

GC 유형별 발생 횟수: - Young (Normal) (G1 Evacuation Pause): 142 - Young (Normal) (GCLocker Initiated GC): 1

## 2. API 통계 (GC 추출)

API 요청 수: 4205
총 API 실행 시간: 2219983.00ms
평균 API 응답 시간: 527.94ms
최소 API 응답 시간: 70.00ms
최대 API 응답 시간: 1866.00ms
테스트 기간: 139.88초
TPS(초당 트랜잭션): 30.06
P90 응답 시간: 1010.00ms
P95 응답 시간: 1085.00ms
P99 응답 시간: 1226.00ms

API 상태 코드 분포: - 200: 4205

API 버전 분포: - pure: 4205

## 3. K6 성능 지표

API 버전: pure
총 요청 수: 4215
테스트 기간: 141.23초
TPS: 29.84
평균 응답 시간: 711.81ms
최소 응답 시간: 75.03ms
중간값 응답 시간: 621.26ms
최대 응답 시간: 2208.09ms
P90 응답 시간: 1371.60ms
P95 응답 시간: 1432.74ms
P99 응답 시간: 1575.30ms
실패율: 0.00%
최대 가상 사용자 수: 100

HTTP 요청 상세 시간: - 대기 시간(waiting): 706.83ms - 연결 시간(connecting): 0.03ms - 송신 시간(sending): 0.03ms - 수신 시간(receiving): 4.95ms

## 4. GC-API 상관관계 분석

API 호출 중 발생한 GC 수: 141
GC 발생 API 요청 수: 2612
GC 미발생 API 요청 수: 1593
전체 API 대비 GC 발생 API 비율: 62.12%

응답 시간 비교: - GC 발생 API 평균 응답 시간: 730.44ms - GC 미발생 API 평균 응답 시간: 195.91ms - 응답 시간 차이: 534.53ms - GC 영향 비율: 272.84%

백분위 응답 시간 비교: - GC 발생 API P95 응답 시간: 1123.00ms - GC 미발생 API P95 응답 시간: 450.40ms

최소/최대 응답 시간 비교: - GC 발생 API 최소 응답 시간: 81.00ms - GC 미발생 API 최소 응답 시간: 70.00ms - GC 발생 API 최대 응답 시간: 1866.00ms - GC 미발생 API 최대 응답 시간: 692.00ms

## 5. 효율성 지표

요청당 GC 발생 비율: 0.034007
요청당 메모리 회수량: 9.12MB
총 실행 시간 대비 GC 소요 시간 비율: 0.04%
TPS당 GC 발생 수: 4.76

K6 결과 비교:
로그 파싱 API 요청 / K6 총 요청 비율: 99.76%
로그 파싱 평균 응답 시간 / K6 평균 응답 시간 비율: 74.17%
(3)Optimized 버전
1회차
============================================
        GC-API 상관관계 분석 보고서
============================================

분석 시간: 2025-05-02 12:37:51
로그 파일: results\temp_optimized_case1_log.txt

## 1. GC 통계
GC 발생 횟수: 186
총 GC 소요 시간: 768.54ms
평균 GC 시간: 4.13ms
최대 GC 일시 정지 시간: 7.11ms
총 회수 메모리량: 50246MB
평균 메모리 회수량: 270.14MB
테스트 기간: 128.30초
초당 GC 발생 수: 1.4497
분당 GC 발생 수: 86.98

GC 유형별 발생 횟수:
  - Young (Normal) (G1 Evacuation Pause): 186

## 2. API 통계 (GC 추출)
API 요청 수: 6795
총 API 실행 시간: 337565.00ms
평균 API 응답 시간: 49.68ms
최소 API 응답 시간: 28.00ms
최대 API 응답 시간: 191.00ms
테스트 기간: 139.50초
TPS(초당 트랜잭션): 48.71
P90 응답 시간: 66.00ms
P95 응답 시간: 74.00ms
P99 응답 시간: 94.00ms

API 상태 코드 분포:
  - 200: 6795

API 버전 분포:
  - optimized: 6795

## 3. K6 성능 지표
API 버전: optimized
총 요청 수: 6799
테스트 기간: 140.81초
TPS: 48.28
평균 응답 시간: 56.17ms
최소 응답 시간: 30.93ms
중간값 응답 시간: 52.75ms
최대 응답 시간: 301.59ms
P90 응답 시간: 74.15ms
P95 응답 시간: 85.40ms
P99 응답 시간: 129.95ms
실패율: 0.00%
최대 가상 사용자 수: 100

HTTP 요청 상세 시간:
  - 대기 시간(waiting): 52.70ms
  - 연결 시간(connecting): 0.01ms
  - 송신 시간(sending): 0.10ms
  - 수신 시간(receiving): 3.37ms

## 4. GC-API 상관관계 분석
API 호출 중 발생한 GC 수: 185
GC 발생 API 요청 수: 897
GC 미발생 API 요청 수: 5898
전체 API 대비 GC 발생 API 비율: 13.20%

응답 시간 비교:
  - GC 발생 API 평균 응답 시간: 58.93ms
  - GC 미발생 API 평균 응답 시간: 48.27ms
  - 응답 시간 차이: 10.66ms
  - GC 영향 비율: 22.08%

백분위 응답 시간 비교:
  - GC 발생 API P95 응답 시간: 86.00ms
  - GC 미발생 API P95 응답 시간: 71.00ms

최소/최대 응답 시간 비교:
  - GC 발생 API 최소 응답 시간: 33.00ms
  - GC 미발생 API 최소 응답 시간: 28.00ms
  - GC 발생 API 최대 응답 시간: 162.00ms
  - GC 미발생 API 최대 응답 시간: 191.00ms

## 5. 효율성 지표
요청당 GC 발생 비율: 0.027373
요청당 메모리 회수량: 7.39MB
총 실행 시간 대비 GC 소요 시간 비율: 0.23%
TPS당 GC 발생 수: 3.82

K6 결과 비교:
로그 파싱 API 요청 / K6 총 요청 비율: 99.94%
로그 파싱 평균 응답 시간 / K6 평균 응답 시간 비율: 88.45%
2회차
============================================

분석 시간: 2025-05-02 12:50:56
로그 파일: results\temp_optimized_case1_log.txt

## 1. GC 통계

GC 발생 횟수: 187
총 GC 소요 시간: 814.05ms
평균 GC 시간: 4.35ms
최대 GC 일시 정지 시간: 6.61ms
총 회수 메모리량: 50493MB
평균 메모리 회수량: 270.02MB
테스트 기간: 134.81초
초당 GC 발생 수: 1.3871
분당 GC 발생 수: 83.23

GC 유형별 발생 횟수: - Young (Normal) (G1 Evacuation Pause): 187

## 2. API 통계 (GC 추출)

API 요청 수: 6799
총 API 실행 시간: 336940.00ms
평균 API 응답 시간: 49.56ms
최소 API 응답 시간: 28.00ms
최대 API 응답 시간: 110.00ms
테스트 기간: 139.88초
TPS(초당 트랜잭션): 48.61
P90 응답 시간: 67.00ms
P95 응답 시간: 72.00ms
P99 응답 시간: 84.00ms

API 상태 코드 분포: - 200: 6799

API 버전 분포: - optimized: 6799

## 3. K6 성능 지표

API 버전: optimized
총 요청 수: 6804
테스트 기간: 141.46초
TPS: 48.10
평균 응답 시간: 54.19ms
최소 응답 시간: 31.30ms
중간값 응답 시간: 52.75ms
최대 응답 시간: 118.12ms
P90 응답 시간: 72.42ms
P95 응답 시간: 78.43ms
P99 응답 시간: 93.39ms
실패율: 0.00%
최대 가상 사용자 수: 100

HTTP 요청 상세 시간: - 대기 시간(waiting): 51.35ms - 연결 시간(connecting): 0.01ms - 송신 시간(sending): 0.01ms - 수신 시간(receiving): 2.83ms

## 4. GC-API 상관관계 분석

API 호출 중 발생한 GC 수: 186
GC 발생 API 요청 수: 904
GC 미발생 API 요청 수: 5895
전체 API 대비 GC 발생 API 비율: 13.30%

응답 시간 비교: - GC 발생 API 평균 응답 시간: 59.22ms - GC 미발생 API 평균 응답 시간: 48.08ms - 응답 시간 차이: 11.14ms - GC 영향 비율: 23.18%

백분위 응답 시간 비교: - GC 발생 API P95 응답 시간: 79.85ms - GC 미발생 API P95 응답 시간: 70.00ms

최소/최대 응답 시간 비교: - GC 발생 API 최소 응답 시간: 33.00ms - GC 미발생 API 최소 응답 시간: 28.00ms - GC 발생 API 최대 응답 시간: 110.00ms - GC 미발생 API 최대 응답 시간: 104.00ms

## 5. 효율성 지표

요청당 GC 발생 비율: 0.027504
요청당 메모리 회수량: 7.43MB
총 실행 시간 대비 GC 소요 시간 비율: 0.24%
TPS당 GC 발생 수: 3.85

K6 결과 비교:
로그 파싱 API 요청 / K6 총 요청 비율: 99.93%
로그 파싱 평균 응답 시간 / K6 평균 응답 시간 비율: 91.45%
3회차
============================================
        GC-API 상관관계 분석 보고서
============================================

분석 시간: 2025-05-02 13:00:36
로그 파일: results\temp_optimized_case1_log.txt

## 1. GC 통계
GC 발생 횟수: 187
총 GC 소요 시간: 796.69ms
평균 GC 시간: 4.26ms
최대 GC 일시 정지 시간: 7.14ms
총 회수 메모리량: 50545MB
평균 메모리 회수량: 270.29MB
테스트 기간: 130.83초
초당 GC 발생 수: 1.4293
분당 GC 발생 수: 85.76

GC 유형별 발생 횟수:
  - Young (Normal) (G1 Evacuation Pause): 187

## 2. API 통계 (GC 추출)
API 요청 수: 6816
총 API 실행 시간: 335742.00ms
평균 API 응답 시간: 49.26ms
최소 API 응답 시간: 28.00ms
최대 API 응답 시간: 119.00ms
테스트 기간: 139.95초
TPS(초당 트랜잭션): 48.70
P90 응답 시간: 65.00ms
P95 응답 시간: 70.00ms
P99 응답 시간: 82.00ms

API 상태 코드 분포:
  - 200: 6816

API 버전 분포:
  - optimized: 6816

## 3. K6 성능 지표
API 버전: optimized
총 요청 수: 6822
테스트 기간: 141.38초
TPS: 48.25
평균 응답 시간: 53.96ms
최소 응답 시간: 30.16ms
중간값 응답 시간: 52.90ms
최대 응답 시간: 124.54ms
P90 응답 시간: 70.81ms
P95 응답 시간: 76.33ms
P99 응답 시간: 89.68ms
실패율: 0.00%
최대 가상 사용자 수: 100

HTTP 요청 상세 시간:
  - 대기 시간(waiting): 51.06ms
  - 연결 시간(connecting): 0.01ms
  - 송신 시간(sending): 0.01ms
  - 수신 시간(receiving): 2.89ms

## 4. GC-API 상관관계 분석
API 호출 중 발생한 GC 수: 187
GC 발생 API 요청 수: 823
GC 미발생 API 요청 수: 5993
전체 API 대비 GC 발생 API 비율: 12.07%

응답 시간 비교:
  - GC 발생 API 평균 응답 시간: 57.99ms
  - GC 미발생 API 평균 응답 시간: 48.06ms
  - 응답 시간 차이: 9.93ms
  - GC 영향 비율: 20.66%

백분위 응답 시간 비교:
  - GC 발생 API P95 응답 시간: 78.00ms
  - GC 미발생 API P95 응답 시간: 68.00ms

최소/최대 응답 시간 비교:
  - GC 발생 API 최소 응답 시간: 32.00ms
  - GC 미발생 API 최소 응답 시간: 28.00ms
  - GC 발생 API 최대 응답 시간: 98.00ms
  - GC 미발생 API 최대 응답 시간: 119.00ms

## 5. 효율성 지표
요청당 GC 발생 비율: 0.027435
요청당 메모리 회수량: 7.42MB
총 실행 시간 대비 GC 소요 시간 비율: 0.24%
TPS당 GC 발생 수: 3.84

K6 결과 비교:
로그 파싱 API 요청 / K6 총 요청 비율: 99.91%
로그 파싱 평균 응답 시간 / K6 평균 응답 시간 비율: 91.29%
(4)
Graph 버전
1회차
============================================

분석 시간: 2025-05-02 13:43:35
로그 파일: results\temp_graph_case1_log.txt

## 1. GC 통계

GC 발생 횟수: 188
총 GC 소요 시간: 806.39ms
평균 GC 시간: 4.29ms
최대 GC 일시 정지 시간: 7.96ms
총 회수 메모리량: 50822MB
평균 메모리 회수량: 270.33MB
테스트 기간: 130.99초
초당 GC 발생 수: 1.4353
분당 GC 발생 수: 86.12

GC 유형별 발생 횟수: - Young (Normal) (G1 Evacuation Pause): 188

## 2. API 통계 (GC 추출)

API 요청 수: 6828
총 API 실행 시간: 284311.00ms
평균 API 응답 시간: 41.64ms
최소 API 응답 시간: 24.00ms
최대 API 응답 시간: 114.00ms
테스트 기간: 139.86초
TPS(초당 트랜잭션): 48.82
P90 응답 시간: 56.00ms
P95 응답 시간: 61.00ms
P99 응답 시간: 74.00ms

API 상태 코드 분포: - 200: 6828

API 버전 분포: - graph: 6828

## 3. K6 성능 지표

API 버전: graph
총 요청 수: 6836
테스트 기간: 141.10초
TPS: 48.45
평균 응답 시간: 46.11ms
최소 응답 시간: 26.51ms
중간값 응답 시간: 44.84ms
최대 응답 시간: 126.90ms
P90 응답 시간: 60.94ms
P95 응답 시간: 66.13ms
P99 응답 시간: 82.07ms
실패율: 0.00%
최대 가상 사용자 수: 100

HTTP 요청 상세 시간: - 대기 시간(waiting): 43.39ms - 연결 시간(connecting): 0.01ms - 송신 시간(sending): 0.01ms - 수신 시간(receiving): 2.71ms

## 4. GC-API 상관관계 분석

API 호출 중 발생한 GC 수: 187
GC 발생 API 요청 수: 757
GC 미발생 API 요청 수: 6071
전체 API 대비 GC 발생 API 비율: 11.09%

응답 시간 비교: - GC 발생 API 평균 응답 시간: 49.65ms - GC 미발생 API 평균 응답 시간: 40.64ms - 응답 시간 차이: 9.01ms - GC 영향 비율: 22.18%

백분위 응답 시간 비교: - GC 발생 API P95 응답 시간: 69.00ms - GC 미발생 API P95 응답 시간: 59.00ms

최소/최대 응답 시간 비교: - GC 발생 API 최소 응답 시간: 29.00ms - GC 미발생 API 최소 응답 시간: 24.00ms - GC 발생 API 최대 응답 시간: 114.00ms - GC 미발생 API 최대 응답 시간: 105.00ms

## 5. 효율성 지표

요청당 GC 발생 비율: 0.027534
요청당 메모리 회수량: 7.44MB
총 실행 시간 대비 GC 소요 시간 비율: 0.28%
TPS당 GC 발생 수: 3.85

K6 결과 비교:
로그 파싱 API 요청 / K6 총 요청 비율: 99.88%
로그 파싱 평균 응답 시간 / K6 평균 응답 시간 비율: 90.30%
2회차
============================================
        GC-API 상관관계 분석 보고서
============================================

분석 시간: 2025-05-02 13:48:37
로그 파일: results\temp_graph_case1_log.txt

## 1. GC 통계
GC 발생 횟수: 189
총 GC 소요 시간: 812.42ms
평균 GC 시간: 4.30ms
최대 GC 일시 정지 시간: 12.77ms
총 회수 메모리량: 51095MB
평균 메모리 회수량: 270.34MB
테스트 기간: 139.93초
초당 GC 발생 수: 1.3507
분당 GC 발생 수: 81.04

GC 유형별 발생 횟수:
  - Young (Normal) (G1 Evacuation Pause): 189

## 2. API 통계 (GC 추출)
API 요청 수: 6845
총 API 실행 시간: 291342.00ms
평균 API 응답 시간: 42.56ms
최소 API 응답 시간: 24.00ms
최대 API 응답 시간: 102.00ms
테스트 기간: 140.00초
TPS(초당 트랜잭션): 48.89
P90 응답 시간: 57.00ms
P95 응답 시간: 61.00ms
P99 응답 시간: 70.00ms

API 상태 코드 분포:
  - 200: 6845

API 버전 분포:
  - graph: 6845

## 3. K6 성능 지표
API 버전: graph
총 요청 수: 6853
테스트 기간: 141.48초
TPS: 48.44
평균 응답 시간: 47.21ms
최소 응답 시간: 26.88ms
중간값 응답 시간: 46.19ms
최대 응답 시간: 108.94ms
P90 응답 시간: 62.29ms
P95 응답 시간: 66.57ms
P99 응답 시간: 77.79ms
실패율: 0.00%
최대 가상 사용자 수: 100

HTTP 요청 상세 시간:
  - 대기 시간(waiting): 44.34ms
  - 연결 시간(connecting): 0.01ms
  - 송신 시간(sending): 0.01ms
  - 수신 시간(receiving): 2.87ms

## 4. GC-API 상관관계 분석
API 호출 중 발생한 GC 수: 188
GC 발생 API 요청 수: 767
GC 미발생 API 요청 수: 6078
전체 API 대비 GC 발생 API 비율: 11.21%

응답 시간 비교:
  - GC 발생 API 평균 응답 시간: 50.00ms
  - GC 미발생 API 평균 응답 시간: 41.62ms
  - 응답 시간 차이: 8.38ms
  - GC 영향 비율: 20.12%

백분위 응답 시간 비교:
  - GC 발생 API P95 응답 시간: 66.00ms
  - GC 미발생 API P95 응답 시간: 60.00ms

최소/최대 응답 시간 비교:
  - GC 발생 API 최소 응답 시간: 28.00ms
  - GC 미발생 API 최소 응답 시간: 24.00ms
  - GC 발생 API 최대 응답 시간: 76.00ms
  - GC 미발생 API 최대 응답 시간: 102.00ms

## 5. 효율성 지표
요청당 GC 발생 비율: 0.027611
요청당 메모리 회수량: 7.46MB
총 실행 시간 대비 GC 소요 시간 비율: 0.28%
TPS당 GC 발생 수: 3.87

K6 결과 비교:
로그 파싱 API 요청 / K6 총 요청 비율: 99.88%
로그 파싱 평균 응답 시간 / K6 평균 응답 시간 비율: 90.15%
3회차
============================================

분석 시간: 2025-05-02 13:55:08
로그 파일: results\temp_graph_case1_log.txt

## 1. GC 통계

GC 발생 횟수: 189
총 GC 소요 시간: 845.43ms
평균 GC 시간: 4.47ms
최대 GC 일시 정지 시간: 14.39ms
총 회수 메모리량: 51072MB
평균 메모리 회수량: 270.22MB
테스트 기간: 127.83초
초당 GC 발생 수: 1.4785
분당 GC 발생 수: 88.71

GC 유형별 발생 횟수: - Young (Normal) (G1 Evacuation Pause): 189

## 2. API 통계 (GC 추출)

API 요청 수: 6863
총 API 실행 시간: 294611.00ms
평균 API 응답 시간: 42.93ms
최소 API 응답 시간: 25.00ms
최대 API 응답 시간: 120.00ms
테스트 기간: 139.67초
TPS(초당 트랜잭션): 49.14
P90 응답 시간: 57.00ms
P95 응답 시간: 61.00ms
P99 응답 시간: 69.00ms

API 상태 코드 분포: - 200: 6863

API 버전 분포: - graph: 6863

## 3. K6 성능 지표

API 버전: graph
총 요청 수: 6866
테스트 기간: 140.84초
TPS: 48.75
평균 응답 시간: 47.52ms
최소 응답 시간: 27.52ms
중간값 응답 시간: 46.48ms
최대 응답 시간: 129.39ms
P90 응답 시간: 62.40ms
P95 응답 시간: 66.47ms
P99 응답 시간: 77.08ms
실패율: 0.00%
최대 가상 사용자 수: 100

HTTP 요청 상세 시간: - 대기 시간(waiting): 44.68ms - 연결 시간(connecting): 0.01ms - 송신 시간(sending): 0.01ms - 수신 시간(receiving): 2.84ms

## 4. GC-API 상관관계 분석

API 호출 중 발생한 GC 수: 189
GC 발생 API 요청 수: 811
GC 미발생 API 요청 수: 6052
전체 API 대비 GC 발생 API 비율: 11.82%

응답 시간 비교: - GC 발생 API 평균 응답 시간: 51.52ms - GC 미발생 API 평균 응답 시간: 41.78ms - 응답 시간 차이: 9.74ms - GC 영향 비율: 23.32%

백분위 응답 시간 비교: - GC 발생 API P95 응답 시간: 67.00ms - GC 미발생 API P95 응답 시간: 59.00ms

최소/최대 응답 시간 비교: - GC 발생 API 최소 응답 시간: 30.00ms - GC 미발생 API 최소 응답 시간: 25.00ms - GC 발생 API 최대 응답 시간: 120.00ms - GC 미발생 API 최대 응답 시간: 117.00ms

## 5. 효율성 지표

요청당 GC 발생 비율: 0.027539
요청당 메모리 회수량: 7.44MB
총 실행 시간 대비 GC 소요 시간 비율: 0.29%
TPS당 GC 발생 수: 3.85

K6 결과 비교:
로그 파싱 API 요청 / K6 총 요청 비율: 99.96%
로그 파싱 평균 응답 시간 / K6 평균 응답 시간 비율: 90.33%
5. 결과 종합
(1)Grafana 결과
전체 버전
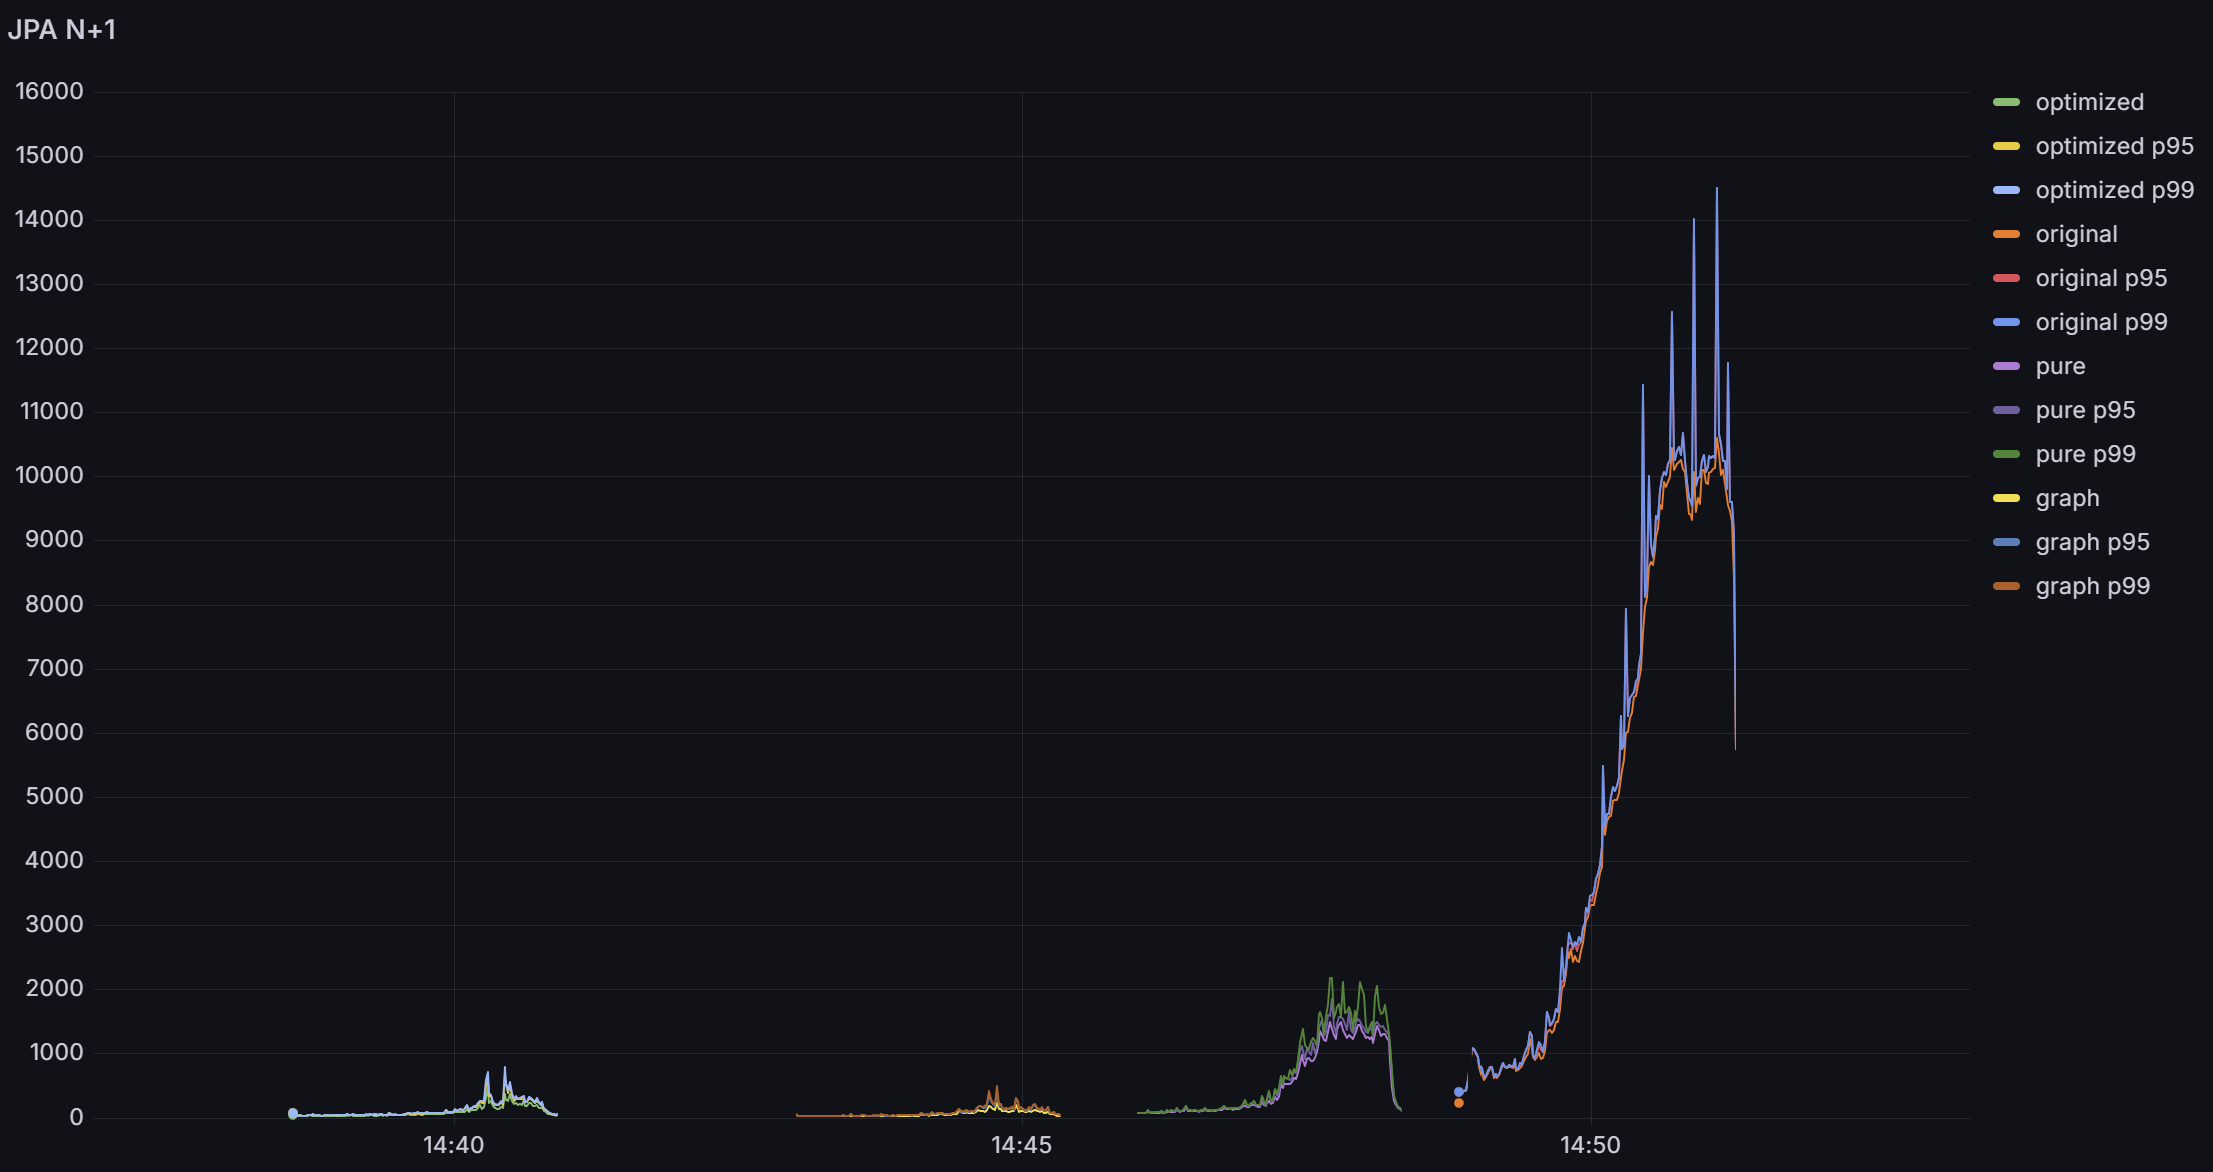
그림 4-1: Case 1 전체 API (평균, P95, P99)
- 좌측부터 optimized, graph, pure, original 버전
1000ms 확대 사진
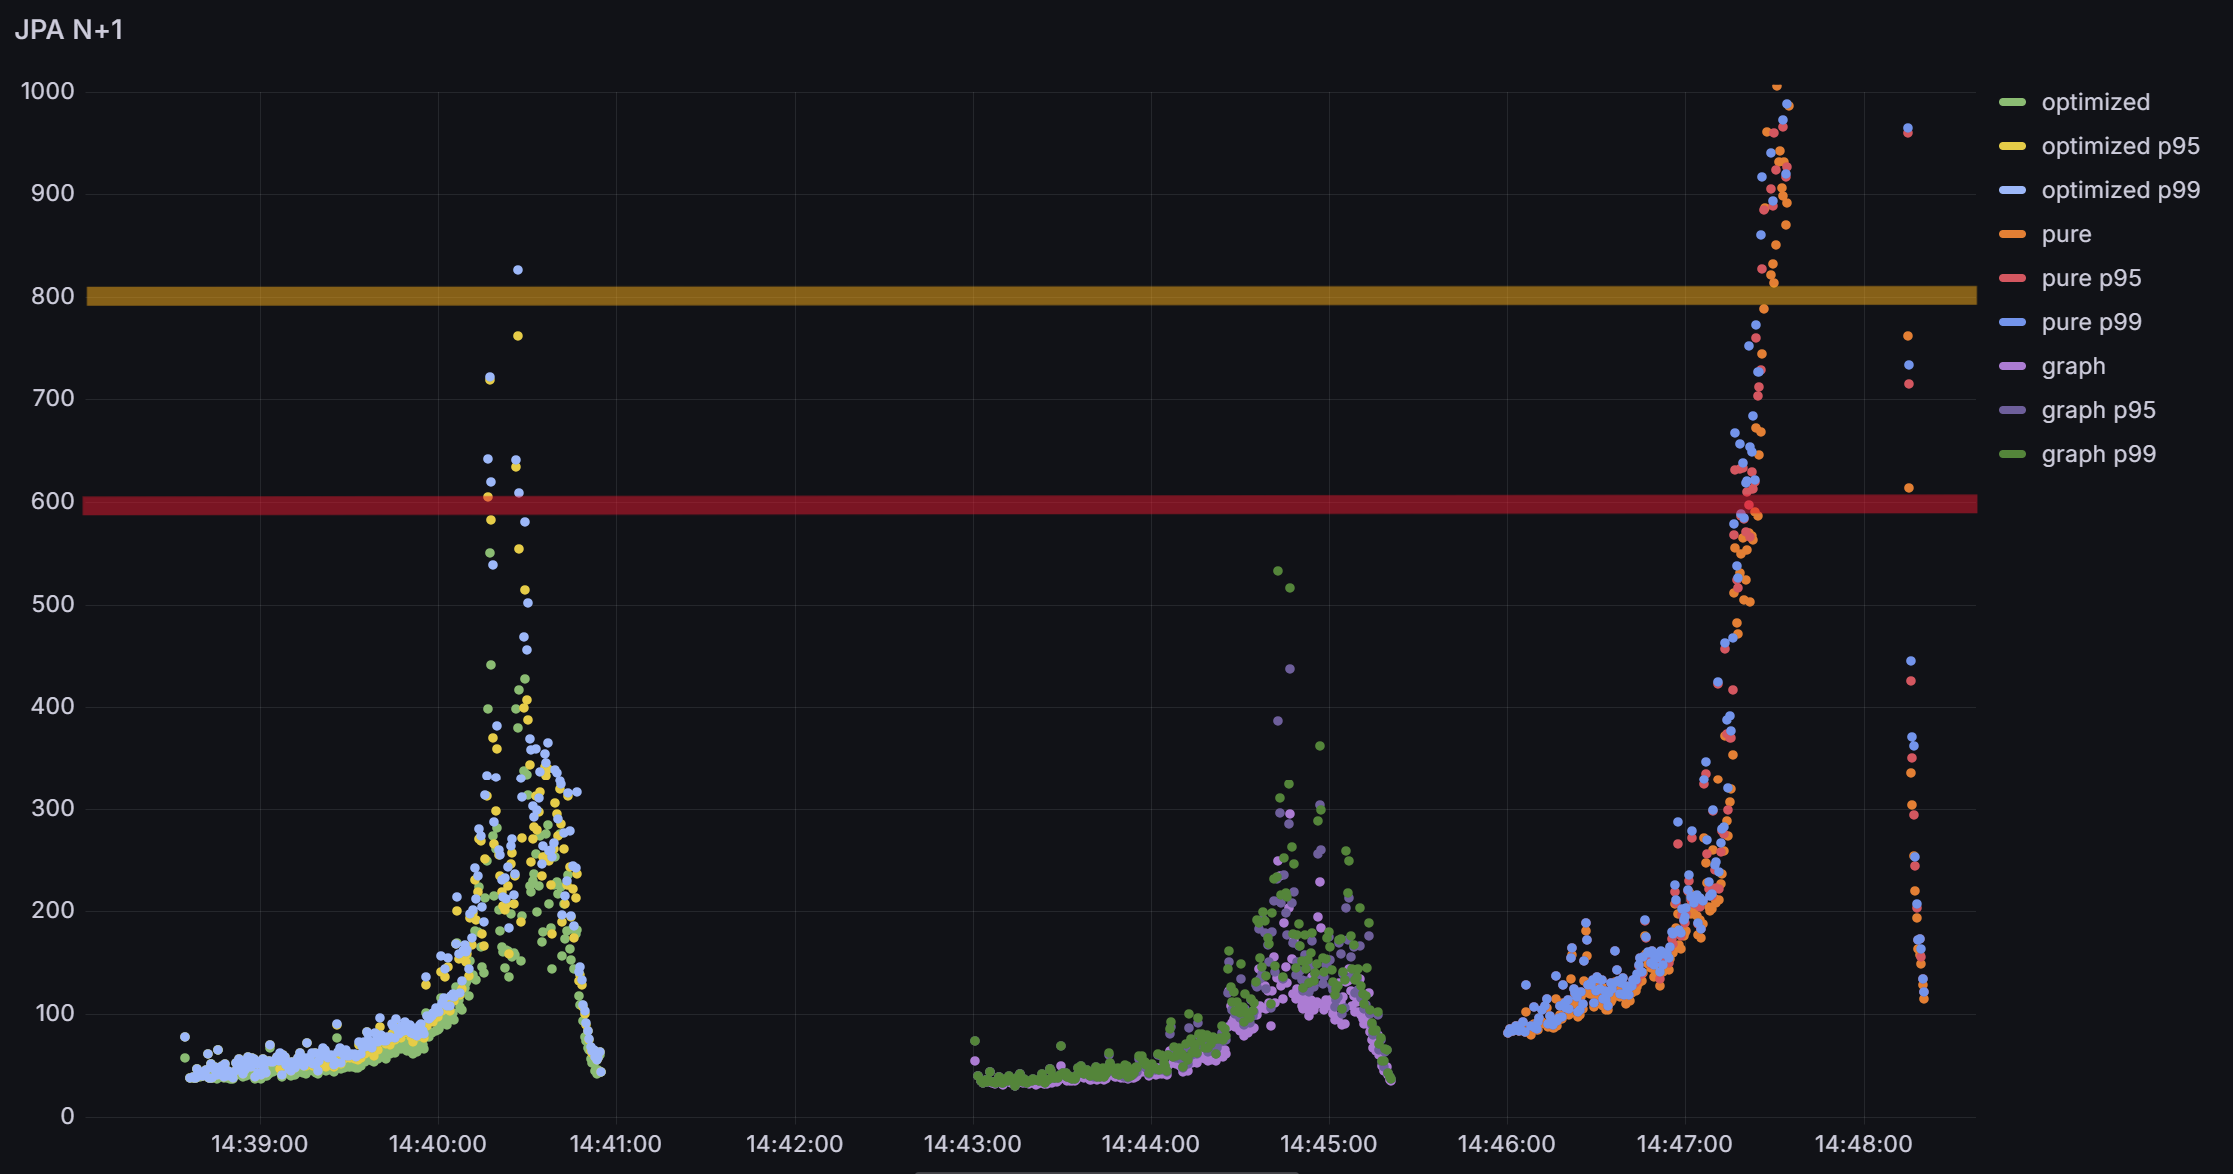
그림 4-2: Case 1 일부 API (평균, P95, P99)
- 좌측부터 optimized, graph, pure
- K6 thresholds 설정 : p(95)<600, p(99)<800
P95 응답 속도
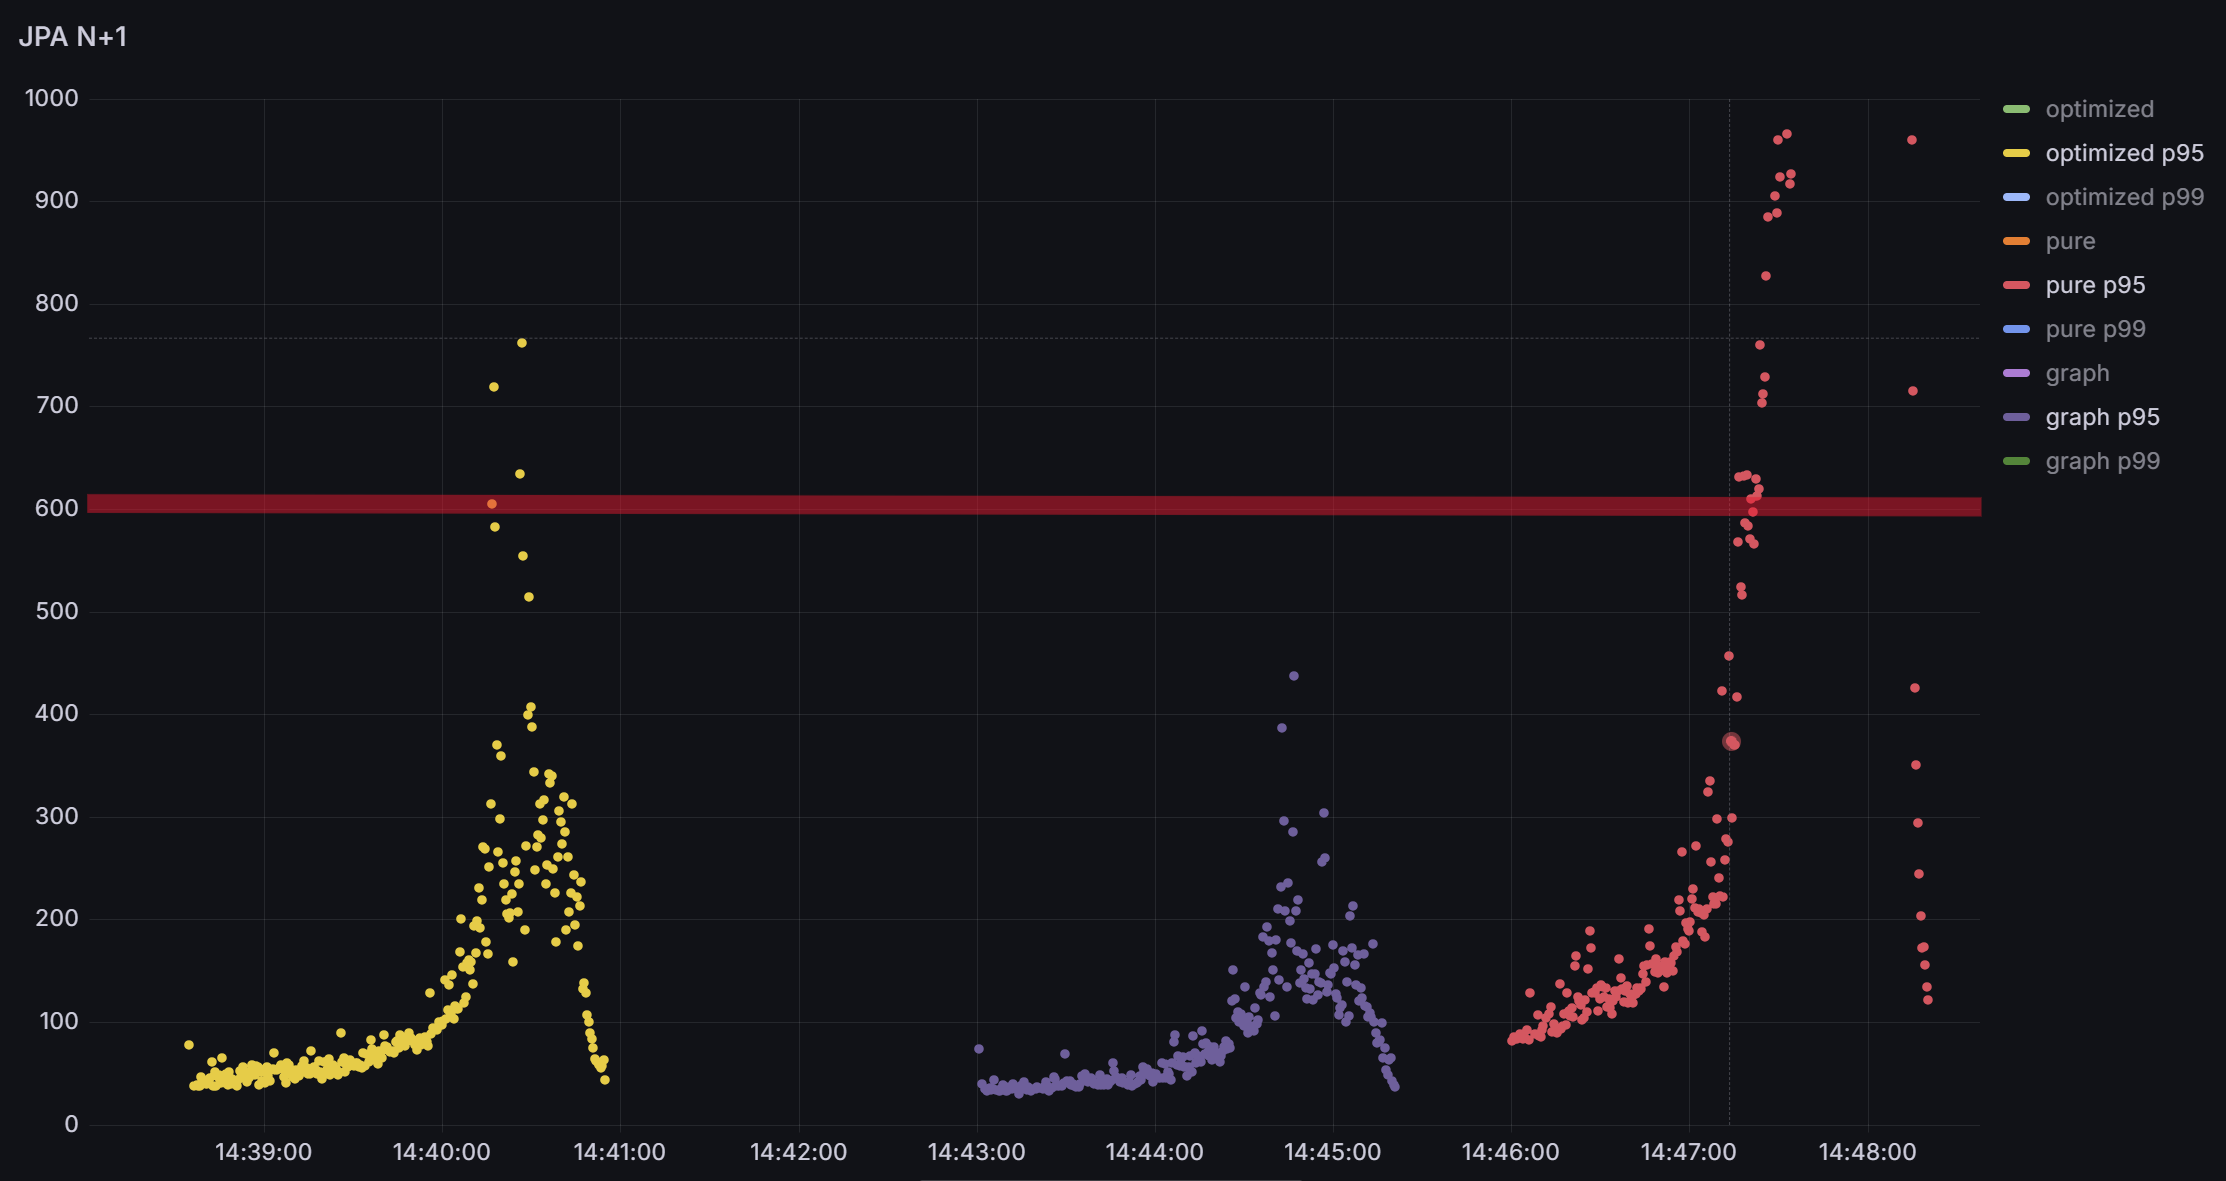
그림 4-3: Case 1 일부 API (P95)
- 좌측부터 optimized, graph, pure
- K6 thresholds 설정 : p(95)<600
P99 응답 속도
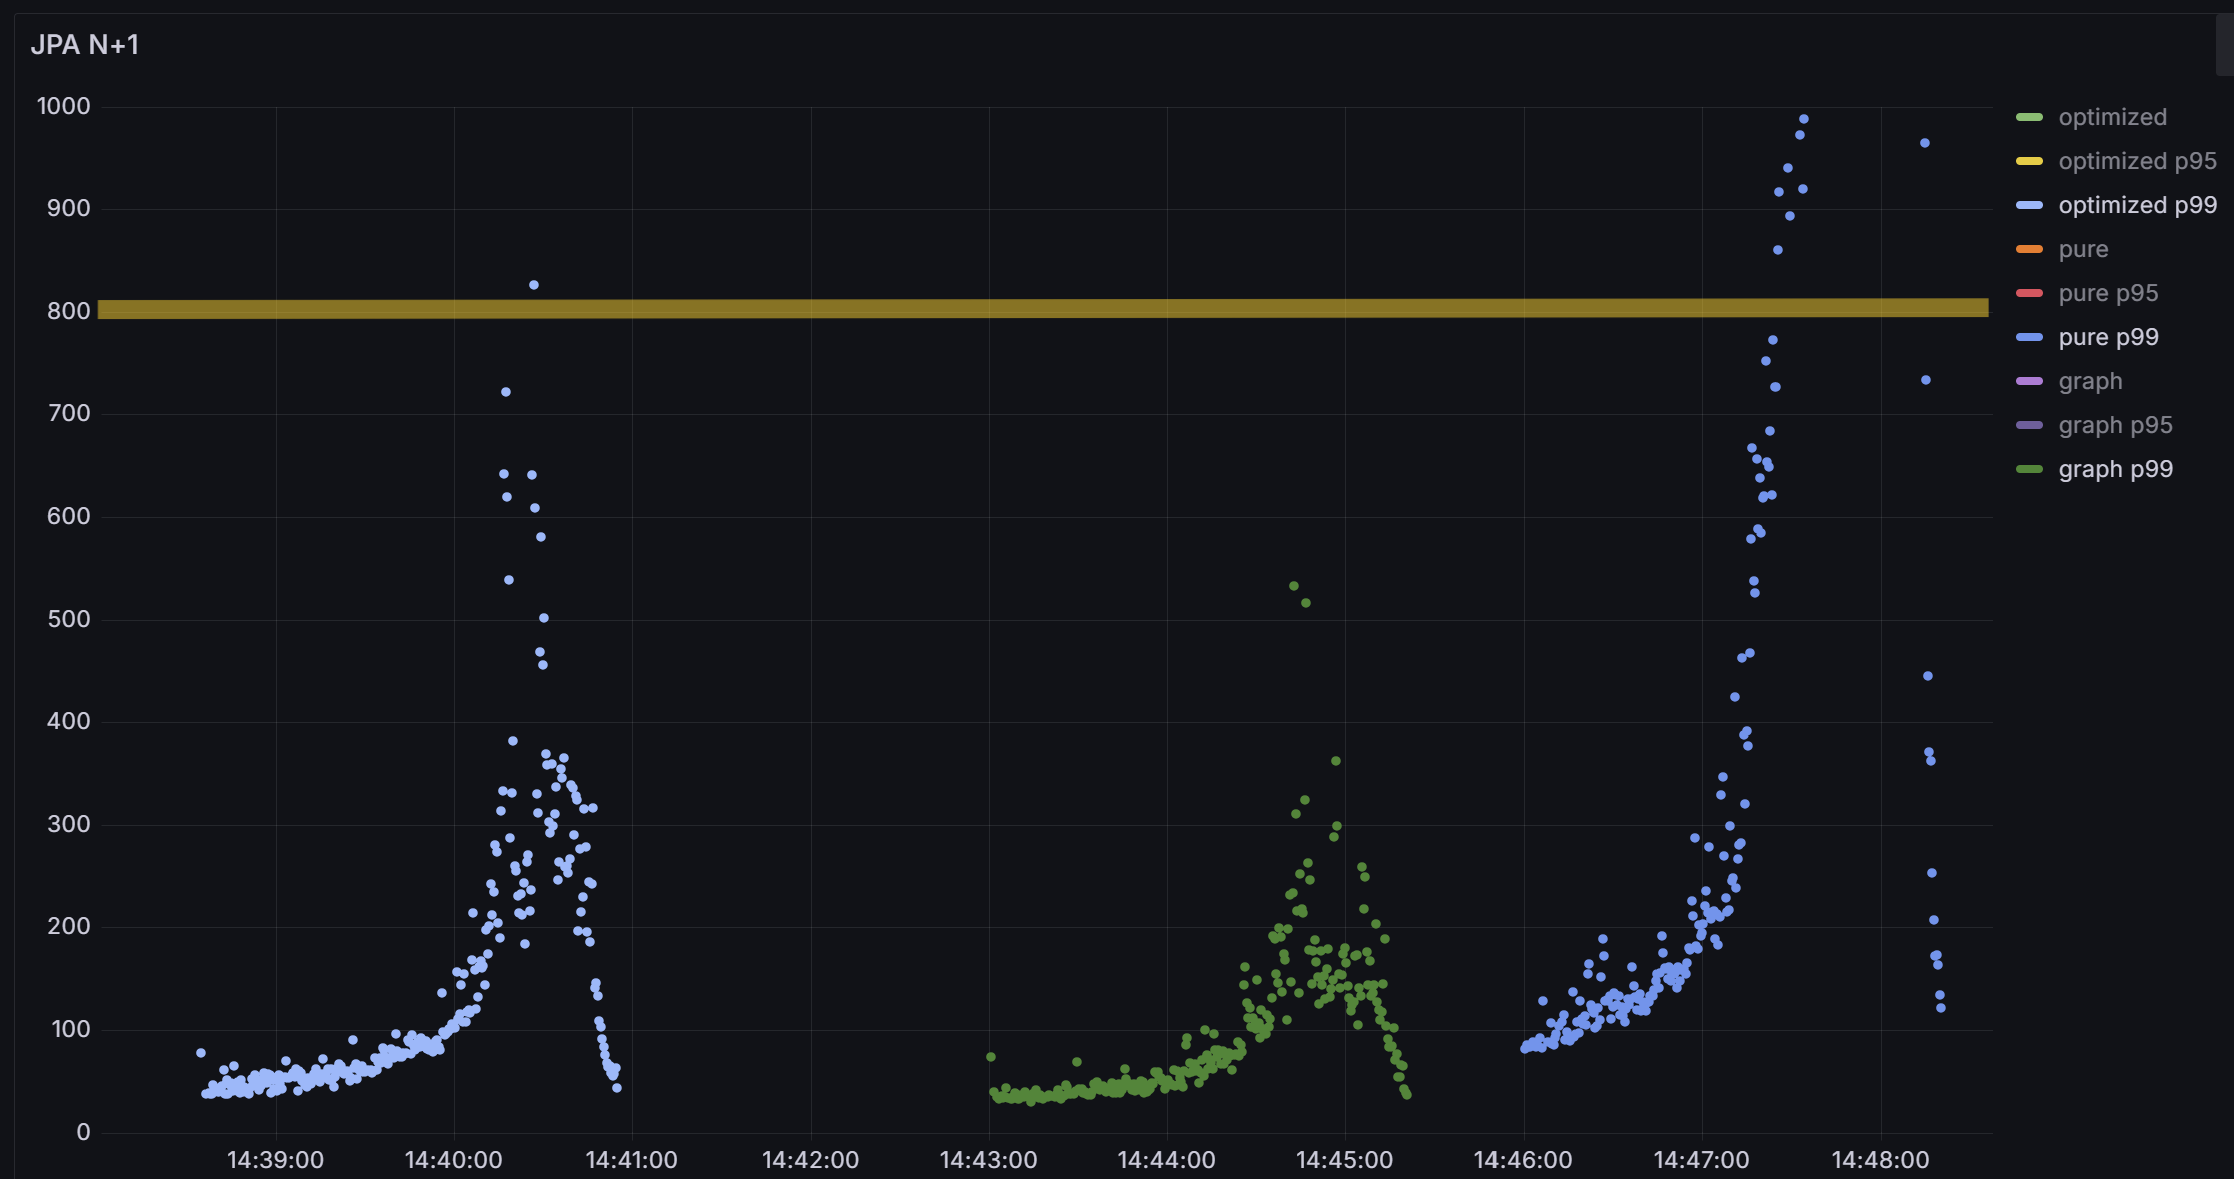
그림 4-4: Case 1 일부 API (P99)
- 좌측부터 optimized, graph, pure
- K6 thresholds 설정 : p(99)<800
(2)케이스 평균 데이터
GC 성능 지표
| 항목 | original | pure | optimized | graph |
|---|---|---|---|---|
| GC 발생 횟수 | 150.33 | 157.33 | 186.67 | 188.67 |
| 평균 GC 시간(ms) | 6.43 | 5.79 | 4.25 | 4.35 |
| 최대 GC 시간(ms) | 13.10 | 15.26 | 6.95 | 11.71 |
| 총 회수 메모리량(MB) | 39502.67 | 42272.33 | 50428.00 | 50996.33 |
| 평균 메모리 회수량(MB) | 262.77 | 268.61 | 270.15 | 270.30 |
API 성능 지표
| 항목 | original | pure | optimized | graph |
|---|---|---|---|---|
| API 요청 수 | 1302.00 | 4655.33 | 6803.33 | 6845.33 |
| 평균 API 응답 시간(ms) | 3332.53 | 427.84 | 49.50 | 42.38 |
| 최소 API 응답 시간(ms) | 388.00 | 70.33 | 28.00 | 24.33 |
| 최대 API 응답 시간(ms) | 9415.33 | 1451.00 | 140.00 | 112.00 |
| API TPS | 9.05 | 33.26 | 48.67 | 48.95 |
| API P90 응답 시간(ms) | 6460.93 | 799.33 | 66.00 | 56.67 |
| API P95 응답 시간(ms) | 7048.97 | 861.67 | 72.00 | 61.00 |
| API P99 응답 시간(ms) | 7813.91 | 978.96 | 86.67 | 71.00 |
GC-API 상관관계 지표
| 항목 | original | pure | optimized | graph |
|---|---|---|---|---|
| API 호출 중 발생한 GC 수 | 149.67 | 156.33 | 186.00 | 188.00 |
| GC 발생 API 요청 수 | 1217.33 | 2684.00 | 874.67 | 778.33 |
| GC 미발생 API 요청 수 | 84.67 | 1971.33 | 5928.67 | 6067.00 |
| GC 발생 API 평균 응답 시간(ms) | 3522.68 | 582.47 | 58.71 | 50.39 |
| GC 미발생 API 평균 응답 시간(ms) | 598.44 | 185.76 | 48.14 | 41.35 |
| GC 발생 API 비율(%) | 93.50 | 58.45 | 12.86 | 11.37 |
| GC 영향 비율(%) | 488.62 | 205.74 | 21.97 | 21.87 |
K6 성능 지표
| 항목 | original | pure | optimized | graph |
|---|---|---|---|---|
| K6 TPS | 8.98 | 32.99 | 48.21 | 48.55 |
| 가상 사용자 최대 | 100.00 | 100.00 | 100.00 | 100.00 |
| K6 평균 응답 시간(ms) | 4835.72 | 573.53 | 54.77 | 46.95 |
| K6 최소 응답 시간(ms) | 85.46 | 74.68 | 30.80 | 26.97 |
| K6 중간값 응답 시간(ms) | 4832.00 | 507.23 | 52.80 | 45.84 |
| K6 최대 응답 시간(ms) | 12842.80 | 1707.85 | 181.42 | 121.74 |
| K6 P90 응답 시간(ms) | 8617.50 | 1078.02 | 72.46 | 61.88 |
| K6 P95 응답 시간(ms) | 8741.84 | 1126.73 | 80.05 | 66.39 |
| K6 P99 응답 시간(ms) | 8998.99 | 1234.28 | 104.34 | 78.98 |
| 실패율(%) | 0.00 | 0.00 | 0.00 | 0.00 |
효율성 지표
| 항목 | original | pure | optimized | graph |
|---|---|---|---|---|
| 요청당 GC 발생 비율 | 0.12 | 0.03 | 0.03 | 0.03 |
| 요청당 메모리 회수량(MB) | 30.34 | 9.08 | 7.41 | 7.45 |
| 총 실행 시간 대비 GC 소요 시간 비율(%) | 0.02 | 0.05 | 0.24 | 0.28 |
다음 페이지로 이동 (4-2. 테스트 결과 2)